

I Tested 12 'Smart' Momentum Indicators. The Winner Was Embarrassingly Simple. (Part 2)
A 26-year test of 12 momentum indicators across the Russell 1000 reveals which signals actually predict next month's winners.

New to SetupAlpha? Join systematic traders and read the full library of 60+ research articles and RealTest code snippets before today’s research.
Hey!
The best stock investments begin with a 1 simple question:
Which indicators actually predict future returns?
That’s much harder than it sounds.
An indicator can look convincing.
It can explain the past perfectly. It can even make intuitive sense. None of that proves it has predictive power.
Fo example, take the 52-week high.
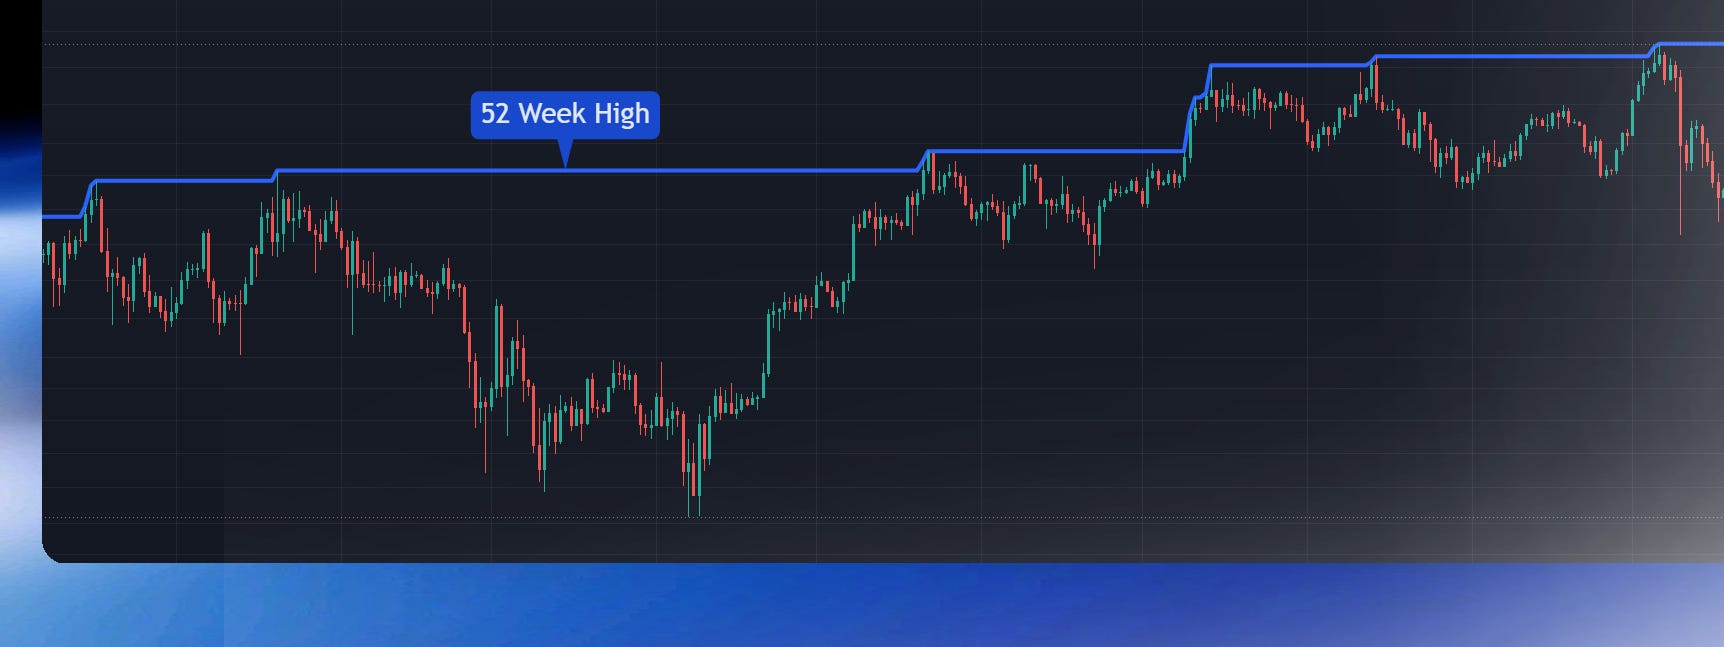
It’s one of the most widely used momentum signals. Stocks near their 52-week highs are expected to keep outperforming.
I tested that assumption.
Each month, I bought the Russell 1000 stocks closest to their 52-week highs and held them for one month.
The strategy underperformed the market by 2.2% per year.
So I tested 11 more momentum indicators under the same conditions.
Most added little.
A few consistently outperformed.
Those are the ones you can put to work today.
If you haven't read Part 1 yet, start there first. It explains the testing framework used throughout this series.

This article focuses on one question:
Which indicators actually predict future returns?

How do you test whether an indicator is actually predictive?
Hedge funds don't trade a signal because the backtest worked. They test whether it predicts future returns.
One of the standard tools is the information coefficient. It measures how well an indicator ranks next month's winners ahead of next month's losers.
That's the score I used throughout this article.
I run the tests, publish the rankings on Substack, and provide the RealTest code.
Every month, I ranked the Russell 1000 by each indicator, bought the top 10% of stocks, held them for one month, and repeated the process 317 times.
Momentum has been studied for more than 30 years. Jegadeesh and Titman’s 1993 paper showed that momentum exists.
Every test includes:
Delisted stocks included
No look-ahead bias
Stock splits adjusted in RealTest
Minimum $5 price
Minimum $5 million daily dollar volume
Results are reported before trading costs and slippage.

#13 RSI picks next month’s losers
The worst result I have measured in this entire project, worse than anything last week.
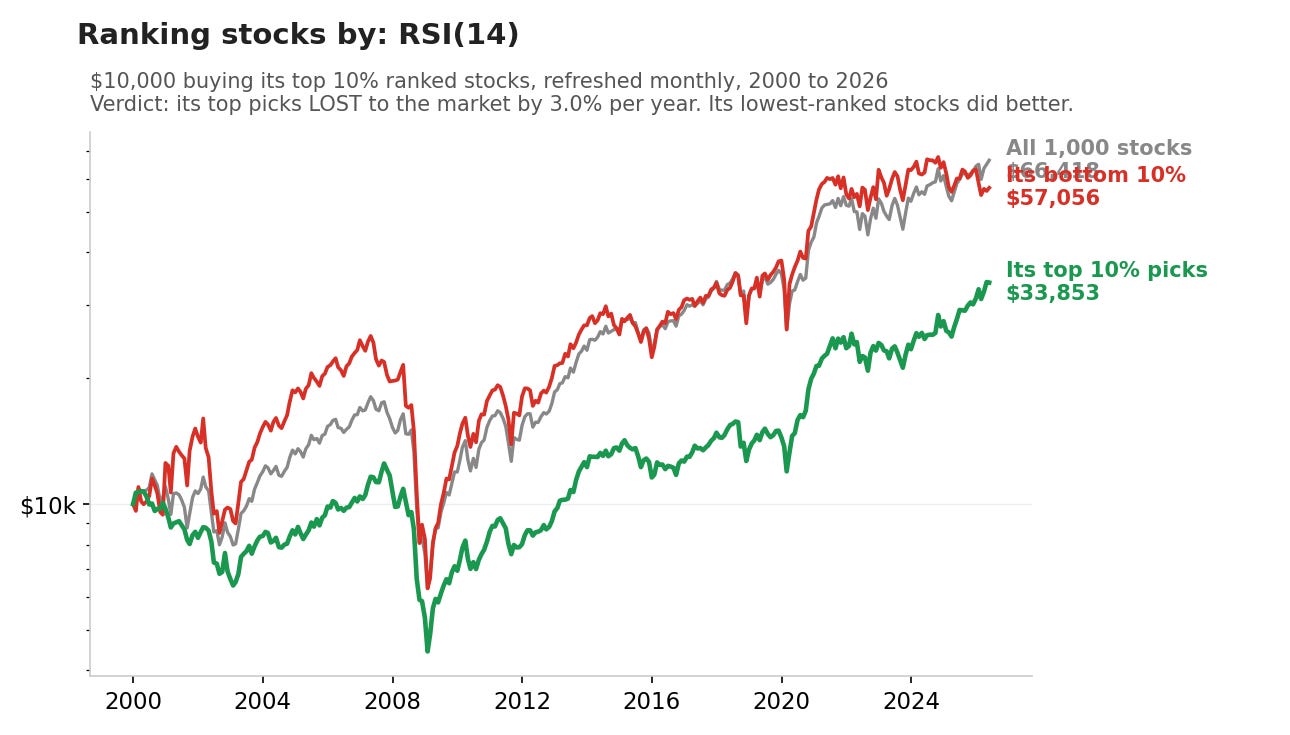
RSI scores a stock from 0 to 100 on how strong its recent two weeks were. Rank stocks by RSI and buy the strongest, and you lose to the market by 3 percent a year. $10,000 became $33,853 while the market made $66,418. The stocks RSI scored lowest made $57,056, so the ranking works better upside down.
The reason comes straight from last week. RSI mostly measures the last two weeks, which puts it squarely in the zone where recent winners reverse instead of keep rising. Jegadeesh documented that reversal in monthly stock returns back in 1990, and I have covered the same effect on the mean-reversion side of the library. A high RSI just flags a stock that already jumped, and ranking by it buys right before the pullback.
RSI is not measuring momentum. It is measuring the part of momentum that reverses.
Data:
	rsi14:	RsiF(C, 14)
#12 The 52-week high finds losers, not winners
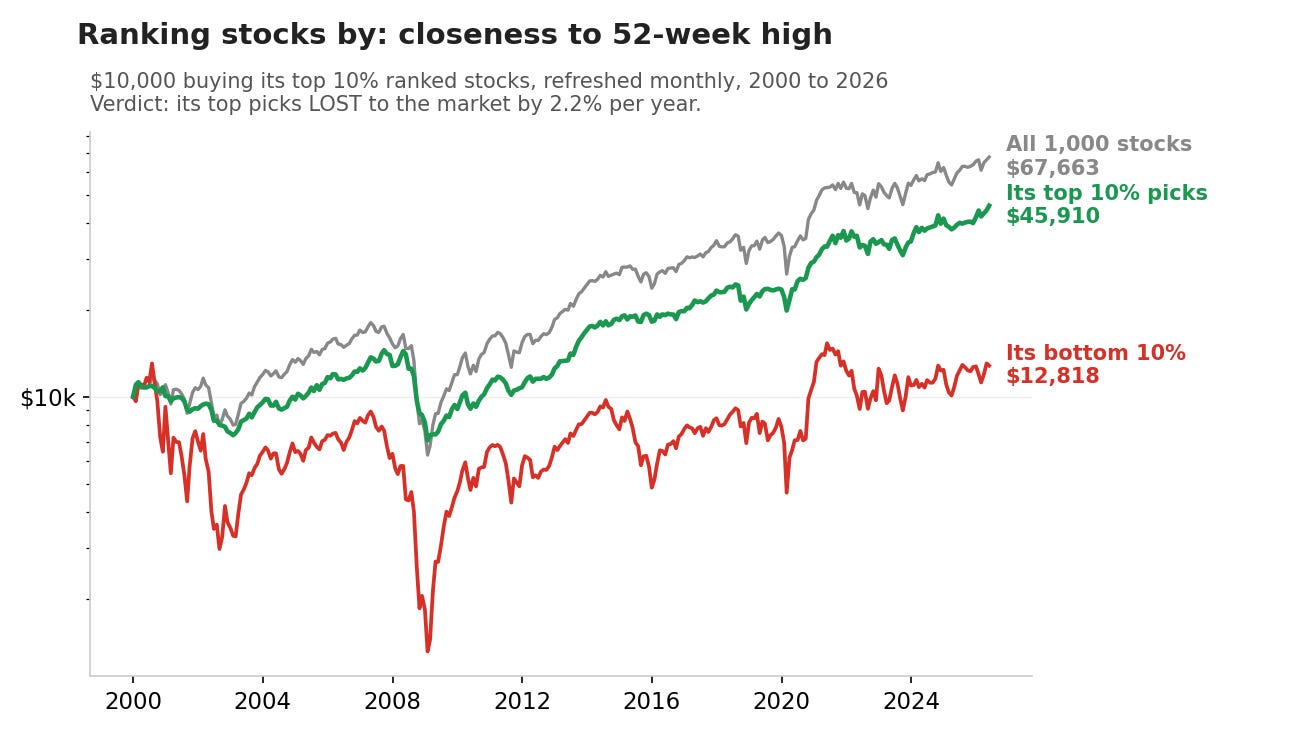
Buying stocks at their 52-week high is one of the most popular momentum ideas there is. In this test, ranking by it and buying the top, stocks at their high lost to the market by 2.2 percent a year over the next month.
A 52-week high is a price level every trader can see. When a stock reaches it, two things happen at once. Traders who bought lower start taking profits, and new buyers hesitate at a price that just set a year-long record. Both add selling pressure right at the high, so the month straight after a fresh high tends to be weak. Meanwhile the stocks far below their high, the bottom of this ranking, are genuinely terrible. $10,000 in them became $12,818.
So over a one-month horizon the 52-week high has a real use, just not the obvious one. It finds stocks to avoid, not stocks to buy.
Data:
	dist52w:	C / Highest(C, 252) - 1
#11 and #10 Two things every trader believes. Both wrong.
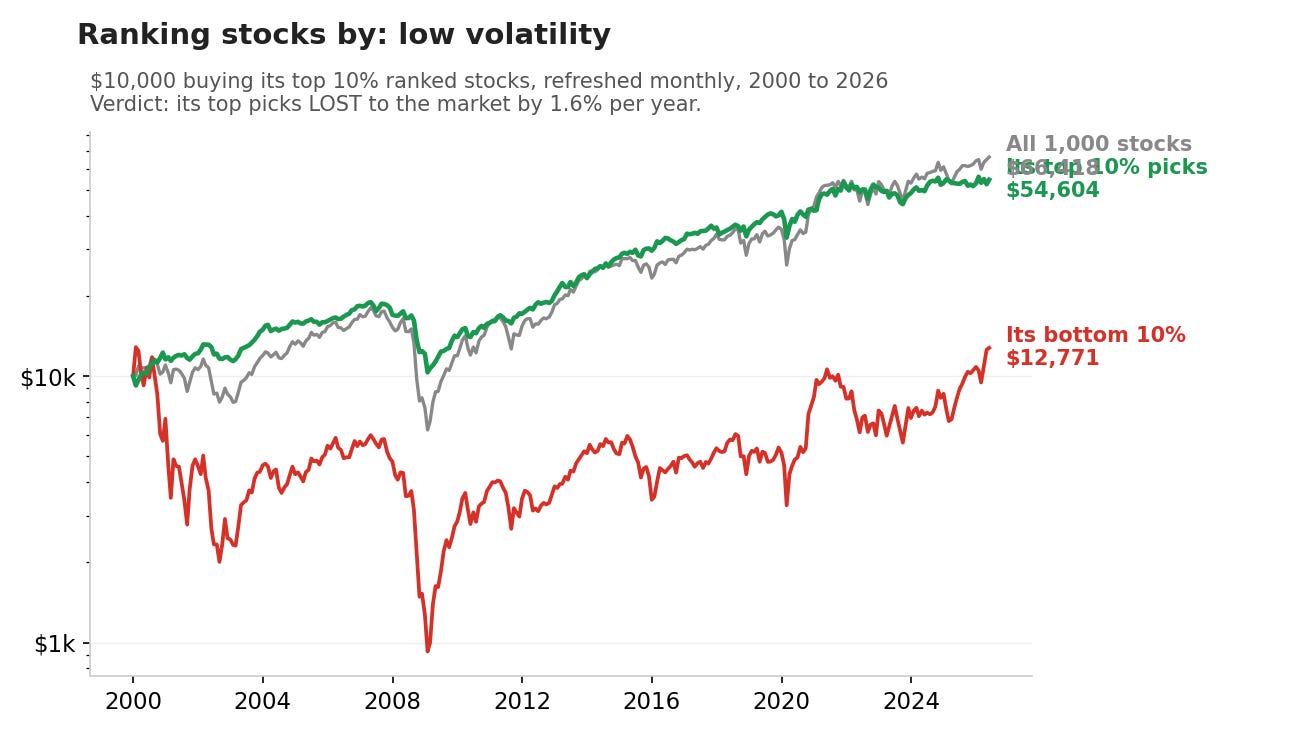
Low volatility, picking the calm stocks, lost by 1.6 percent a year. Calm stocks are fine to own, but as a way to pick next month’s winners they fail. And before you flip it, the wild stocks at the other end made $12,771 out of $10,000 in 26 years. Volatility ranking tells you what to avoid, not what to buy.
Rising volume lost by 0.5 percent a year. “Volume confirms the move” is one of the oldest lines in trading. Ranking stocks by volume growth gave nothing usable in either direction. 317 months, nothing there.
Data:
	vol126:		StdDev(C / C[1] - 1, 126)
	lowvol:		0 - vol126

	dollarVol:	C * V
	volTrend:	Avg(dollarVol, 21) / Avg(dollarVol, 126) - 1
#9 and #8 Real signals, barely worth the trouble
The 12 month return divided by how much the stock swings earns +1.0 percent a year. Dividing by risk helps it a little, but it still starts from the 12 month window, not the 6 month one that won last week. No formula fixes the wrong starting window.
Share of up days earns +1.1 percent a year. Counting how often a stock closed green over 6 months is a real signal, just a small one.
Data:
	vol252:		StdDev(C / C[1] - 1, 252)
	sharpe252:	ROC(C, 252) / vol252

	upDays126:	Sum(IF(C / C[1] - 1 > 0, 1, 0), 126) / 126
#7 The best result before the paywall
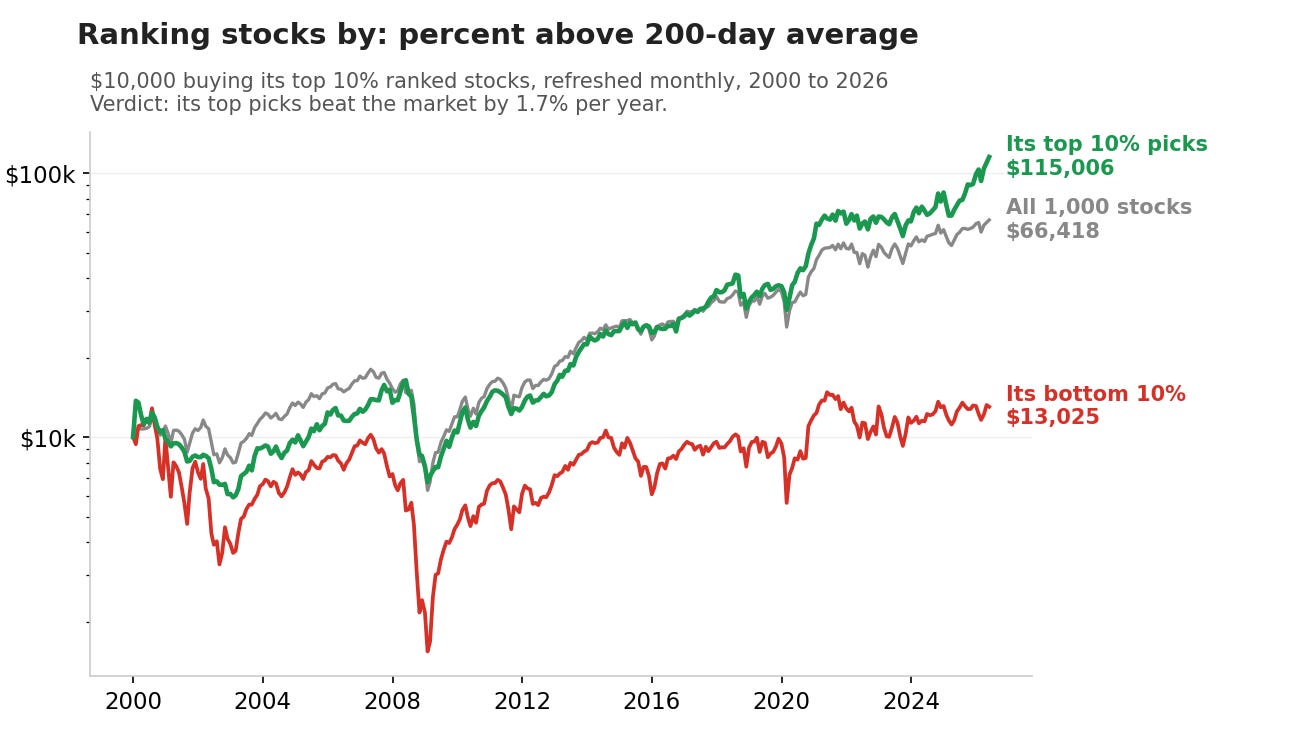
Percent above the 200-day average. How far the price sits above its own 200-day line. Plus 1.7 percent a year, $10,000 to $115,006, the best result on this side of the paywall. It beats the plain 200-day return, and it leaves one question hanging. Does the distance above the line matter, or the direction the line is heading? The locked section answers that first.
Data:
	pctAbove200:	C / Avg(C, 200) - 1
Five indicators left. One of them ties the winner.
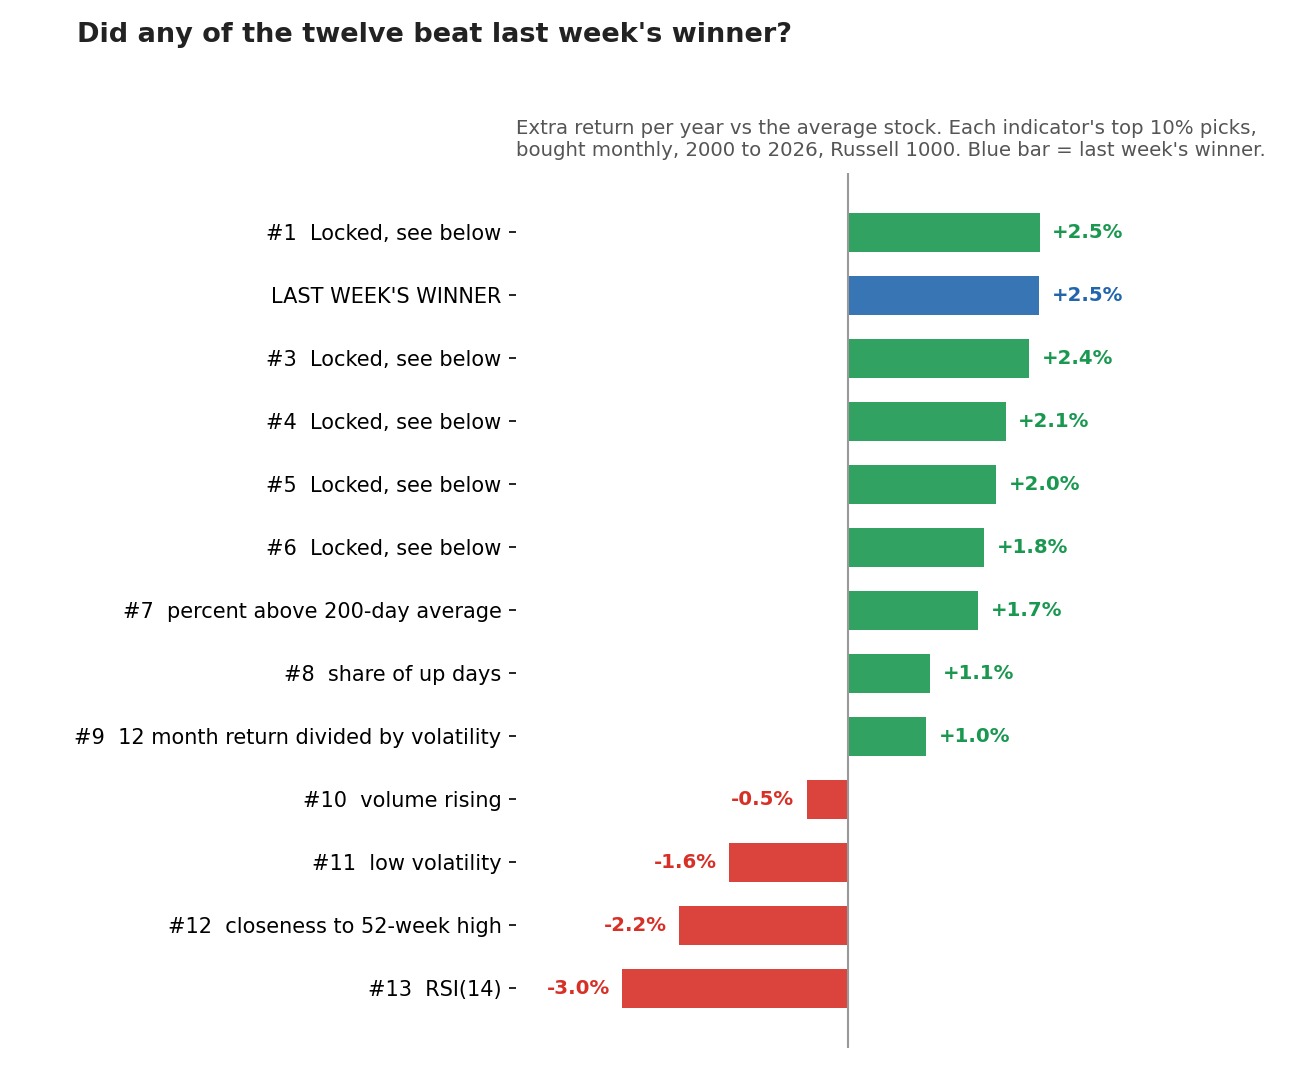
2nd “Last Week’s Winner“ is here.
The blue bar is last week’s winner, at +2.5 percent a year. You just saw the best of the free indicators at #7, and even that sits most of a point behind it. The five that beat #7 are still locked.
One of those five tied the winner almost exactly, one hundredth of a percent apart after 317 months, and it is not a name you would find in any book or video. Guess which one before you scroll. It is none of the famous ones.
Subscribe to see all five, each with its $10,000 chart and the one line of code you paste into RealTest, plus every test in this series as it is published.