

Which Momentum Indicator Best Predicts Next Month? I Tested 21, Worst to Best
Tested on every Russell 1000 stock, every month since 2000. The RealTest code for all 21 is included.

New to SetupAlpha?
Join systematic traders and explore our full library of 60+ research articles and RealTest code snippets before reading today’s research.
Hey!
Which momentum indicator actually tells you what a stock does next month?
I tested 21 of them to find out.
Every month since 2000, I ranked every Russell 1000 stock by each indicator, bought the top 10 percent on paper, and checked the result one month later. That is 317 months, tested 21 times over.
The gap between the worst and the best indicator is 4.5 percent a year. On the same stocks, on the same dates.
The two most famous settings, the 200-day return and the textbook “12 months skip one,” finish mid-table. The winner is a setting almost nobody recommends, and it is one line of code. This is the ranking, worst to best, with the code for each one.

The test in three steps
On the last trading day of each month, rank all Russell 1000 stocks by the indicator.
Buy the top 10 percent of the list, about 90 stocks. Hold them for one month.
Compare against the average stock. Repeat every month, 317 times.
An indicator earns its rank with one number. How much did its top picks beat the market by, per year?
Quant funds run this same test before they start trading a signal with real money. Their name for the score is the information coefficient. It measures one simple thing, how well an indicator’s ranking matched what the stocks actually did the following month.
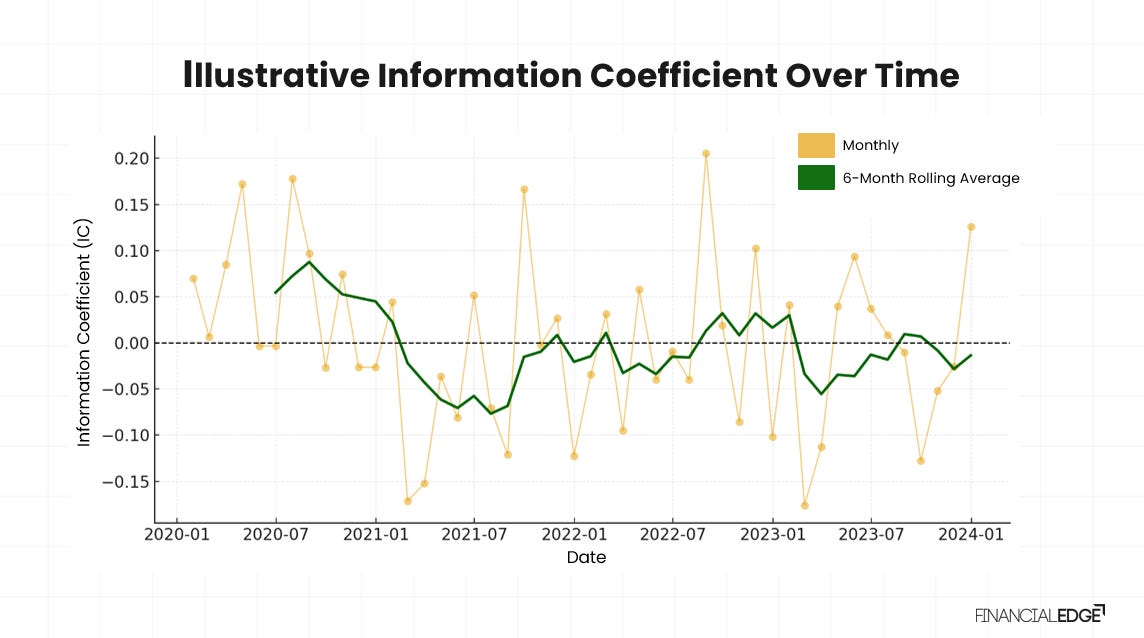
You do not need to remember the name or learn the math behind it. I run the tests. You get the finished ranking and code you can copy into RealTest.

Why you can trust the numbers
Dead companies stay in. The universe is the Russell 1000 as it stood on each date, from Norgate data. Enron is in there too, all the way down to its bankruptcy.
Same stocks for every indicator. A stock enters the test only when all 21 indicators can be computed on it. Every indicator is graded on exactly the same stocks.
No lookahead. The ranking only uses data that existed at that month-end. The result is measured after.
Splits handled. Forward returns come from inside RealTest, checked by hand against Apple’s 7-for-1 stock split.
Only fillable stocks. Minimum $5 price and $5 million daily dollar volume, so every trade in this test could have happened in real life.
Why large caps. Small caps jump on news, an FDA decision or a buyout rumor, and then give the gains back. A momentum ranking buys after the jump and holds through the fall. Large caps move in longer trends. That is where a momentum ranking actually works, and where your order actually fills.
Returns are measured before trading fees and slippage, because this test measures prediction, not a finished strategy. The strategy gets built later in my Substack, one tested decision at a time.
Here is the full scan, ready to run.
Data:
	dollarVol:	C * V
	universe:	InRUI and C >= 5 and Avg(dollarVol, 20) >= 5000000

	mom6:		ROC(C, 126)		// 6 month return, swap in any window
	fwd21:		C[-21] / C - 1	// research only, never a trading rule

Scan:
	Filter:	EndOfMonth and universe and not IsNaN(ROC(C, 504)) and not IsNaN(fwd21)
	mom6:	mom6
	Fwd21:	fwd21
RealTest is the backtesting program I run everything in. C is the closing price, C[21] is the closing price 21 trading days ago, and ROC(C, 126) is the percent change over the last 126 trading days, which is 6 months. Every indicator in this article is a variation of that one idea, and each gets its line of code below.

#21 and #20: the 1 and 2 month returns pick losers
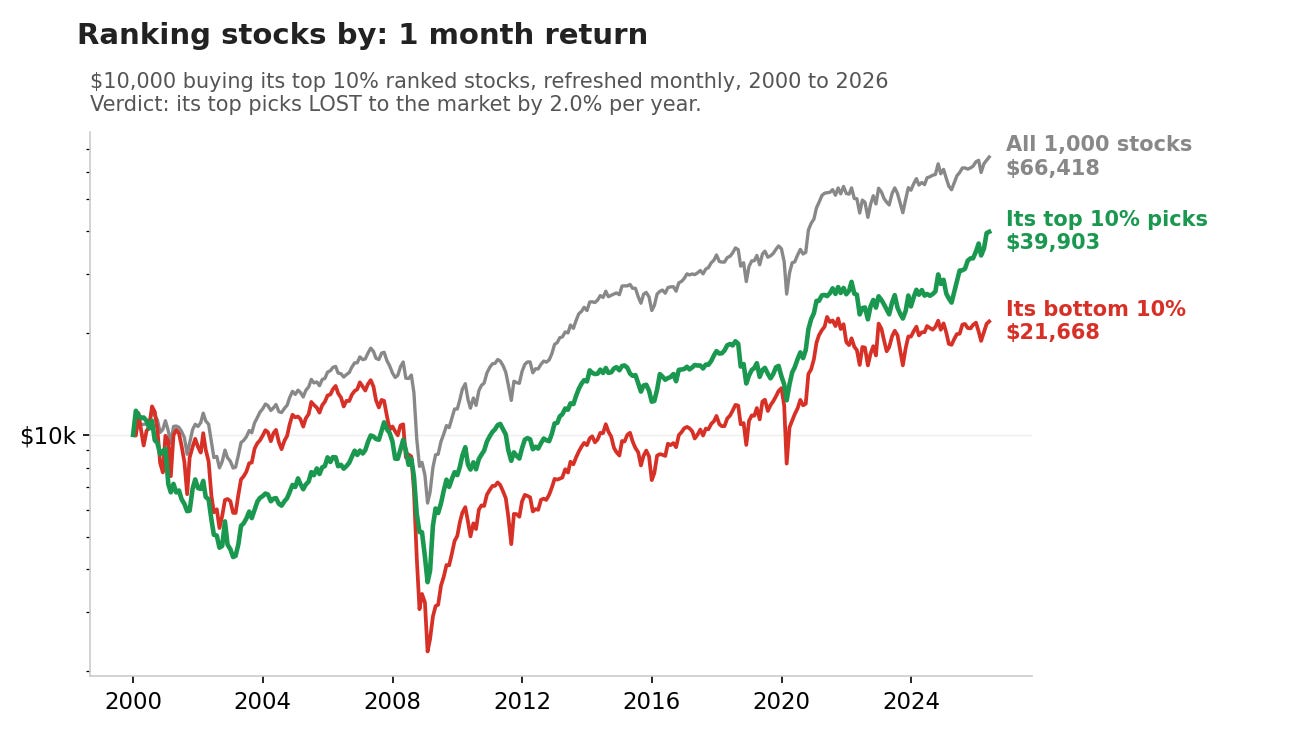
Buy last month’s biggest movers and you trail the market by 2 percent a year. $10,000 in the 1-month indicator’s favorites became $39,903 in 26 years while the market made $66,418.
The reason is simple. Over one month, stocks snap back. The stock that just jumped 30 percent attracts profit taking. The stock that just dropped attracts bargain hunters.
A screener sorted by 1 month performance is not a momentum tool. It is a list of stocks that are about to snap back.
	roc21:	ROC(C, 21)
	roc42:	ROC(C, 42)
#19 and #18: a year and a half is old news
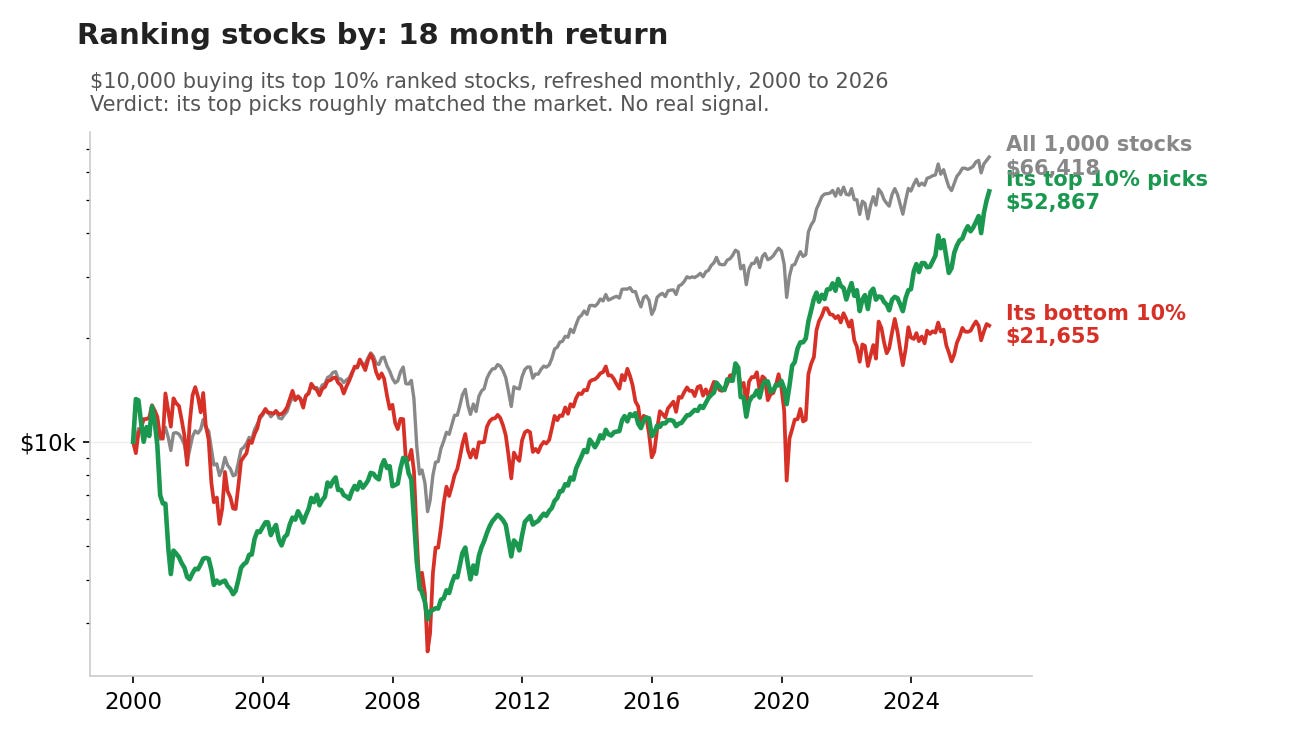
The 18 month return’s top picks lose to the market outright. The 24 month barely breaks even. By then, the market has finished acting on the trend. A longer lookback feels safer. This chart shows what that feeling costs in returns.
	roc378:	ROC(C, 378)
	roc504:	ROC(C, 504)
#17 to #11: the middle of the table
Seven indicators land between +0.5 and +1.0 percent a year. Real but modest.
#17 12 month, skip a quarter (+0.5)
#16 4 month (+0.6)
#15 10 month (+0.8)
#14 3 month (+0.9)
#13 12 month (+1.0)
#12 12 month, skip 2 months (+1.0)
#11 5 month (+1.0)
	mom12_3:	C[63] / C[252] - 1
	roc84:		ROC(C, 84)
	roc210:		ROC(C, 210)
	roc63:		ROC(C, 63)
	roc252:		ROC(C, 252)
	mom12_2:	C[42] / C[252] - 1
	roc105:		ROC(C, 105)
#10, #9, #8: the famous ones
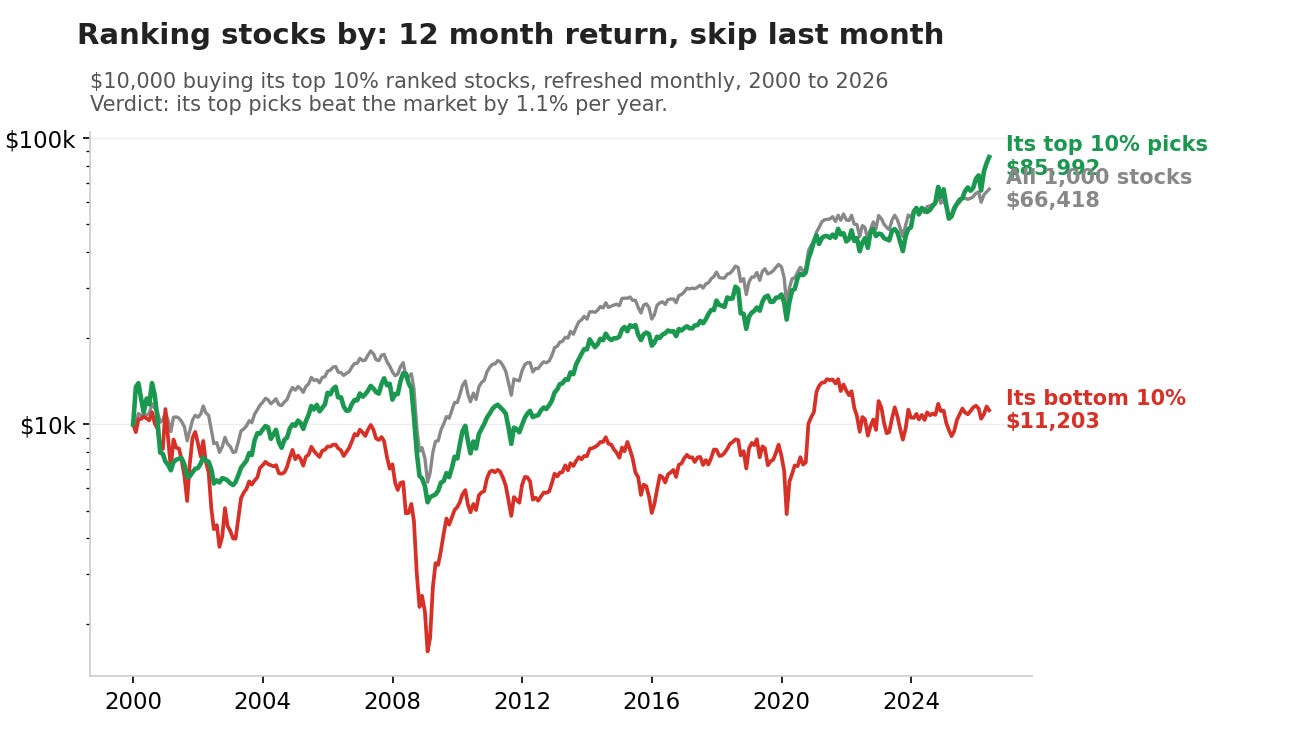
Now the result that surprised me the most.
#10 is the textbook setting. The 12 month return with the last month skipped. The skip exists to avoid the snap-back effect you saw at the bottom of this list. This formula comes from the 1993 academic paper that made momentum famous, and it is the default in every momentum screener. It earns +1.1 percent a year. Still working 33 years after publication, which deserves respect. Still beaten by nine other settings.
#8 is your 200-day. The most famous number on any chart earns +1.2 percent a year. Solid, but mid-table.
#9 comes with a warning. The 3 month with a skip looks fine in the long-term numbers, but it is the one indicator on this list whose result fell apart after 2021. I would not build on it.
	mom12_1:	C[21] / C[252] - 1
	mom3_1:		C[21] / C[63] - 1
	roc200:		ROC(C, 200)
Six are left. Guess the winner before you scroll.
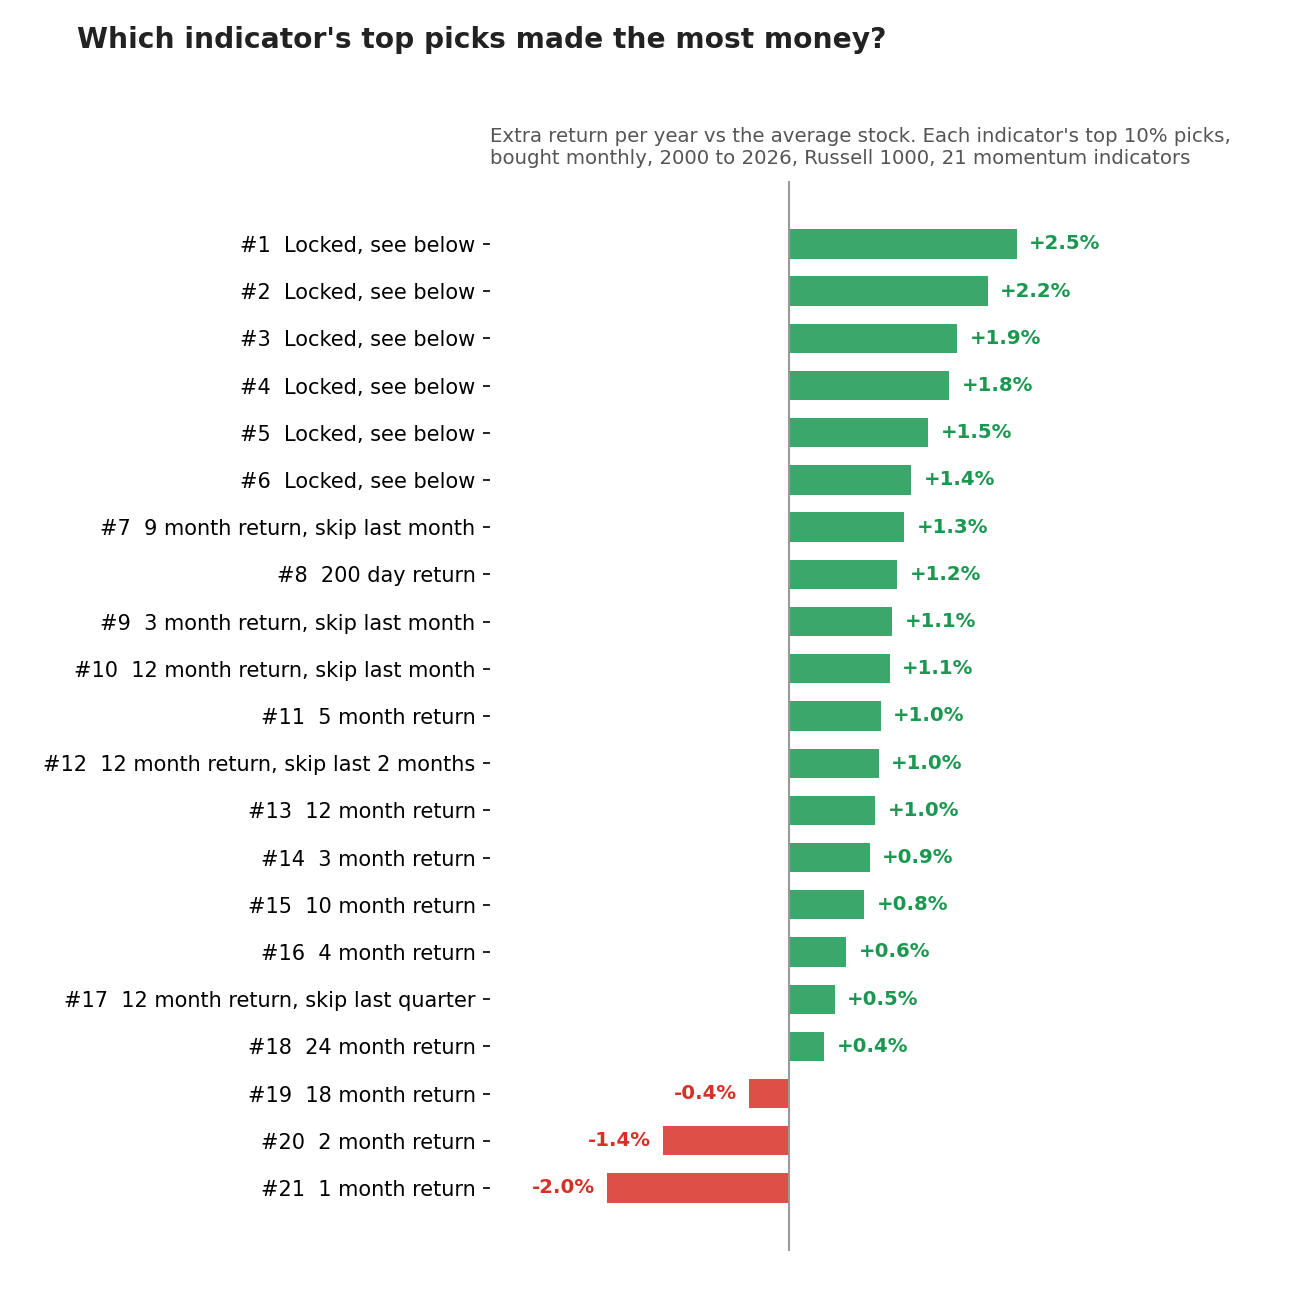
The top six earn +1.4 to +2.5 percent a year over the market. If your screener currently uses the 200-day or the 12-1, the winner roughly doubles your setting, on the same stocks, with one line of code.
Subscribe and the top six open below, each with its money chart and its line of code.