

I Tested 56 Trailing Stops on 105,708 Trades. The One That Wins Most Often Makes the Least Money.
The worst exit here wins 47% of its trades. 8 exits ranked worst to best on identical trades, each with the RealTest code.

New to SetupAlpha? Join systematic traders and read the full library of 70+ research articles and RealTest code snippets before today’s research.
Hey!
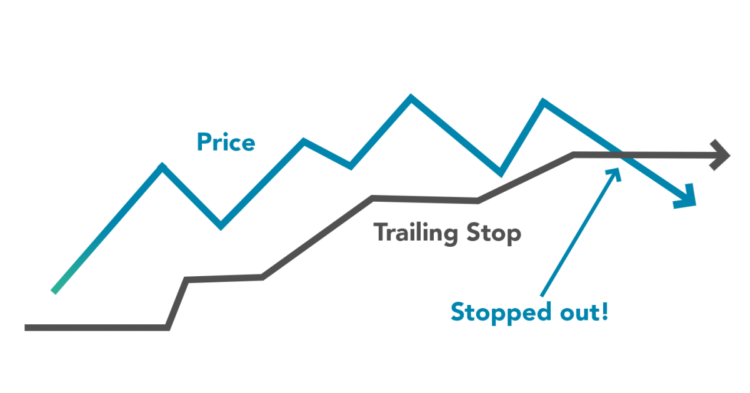
Should your stop move up with the price, or stay where you put it?
Everyone knows the line:
Cut your losers and let your winners run.
It sounds simple. So which exit rule actually does it?
I tested:
56 exit rules
105,708 trades, the same ones every time
26 years
one change at a time, so the only difference between any two results is the exit
Only one of the eight sells losers. The other seven sell positions that are in profit.
They are ranked below, worst to best, each with its line of RealTest code.

Isolating the Exit Across 105,708 Trades
Buy a Russell 1000 stock the day it closes back above its 200-day average, filled at the next open.
Sell when the exit rule fires, or when it closes back below the 200-day average, whichever comes first.
Change the exit rule and run it again. 56 times.
No max positions and no account balance. One share on every crossover, no matter how many happen that day.
That is not how you would trade it. It is how you find out what the exit alone is worth. In a normal backtest, tightening the stop also changes your cash drag, your turnover cost, your position count and which signals you had room to take. Five things move at once and you cannot tell which one moved your number.

What Every Trailing Stop Is Really Fighting
Every version keeps the 200-day exit underneath it, and that changes what the ranking means. That is the backstop that ends a trade in a stock that simply keeps rising and never touches its stop. Without it a position would be held forever and there would be nothing to compare against.
So what this test measures is what a trailing stop adds to an exit you already have. That is also the only version of the question a real trader ever faces, because nobody runs a stop as their only sell rule.
Which is why every ranking below carries one extra number: how often that rule was the one that closed the position, rather than the 200-day exit doing it. A rule that finishes high while almost never ending a trade has not beaten anything. It stayed out of the way.
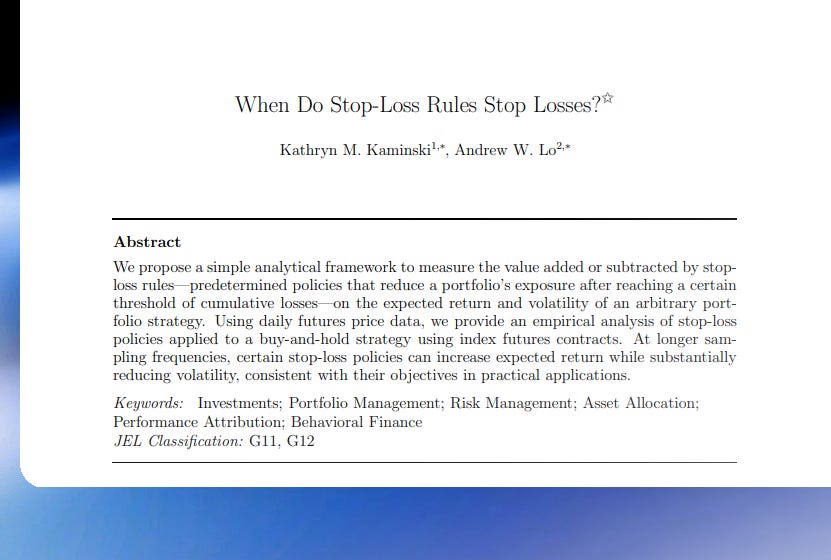
Kaminski and Lo tested it in the Journal of Financial Markets and found that when prices follow a random walk, a simple stop-loss rule always lowers expected return, and that stop-loss strategies generally underperform buying and holding. They also found the exception that makes this worth measuring instead of assuming. Where there is momentum, a stop can add value. Trend-following entries are exactly that.

#8 The Profit-Chaser Wins Often and Still Loses Money
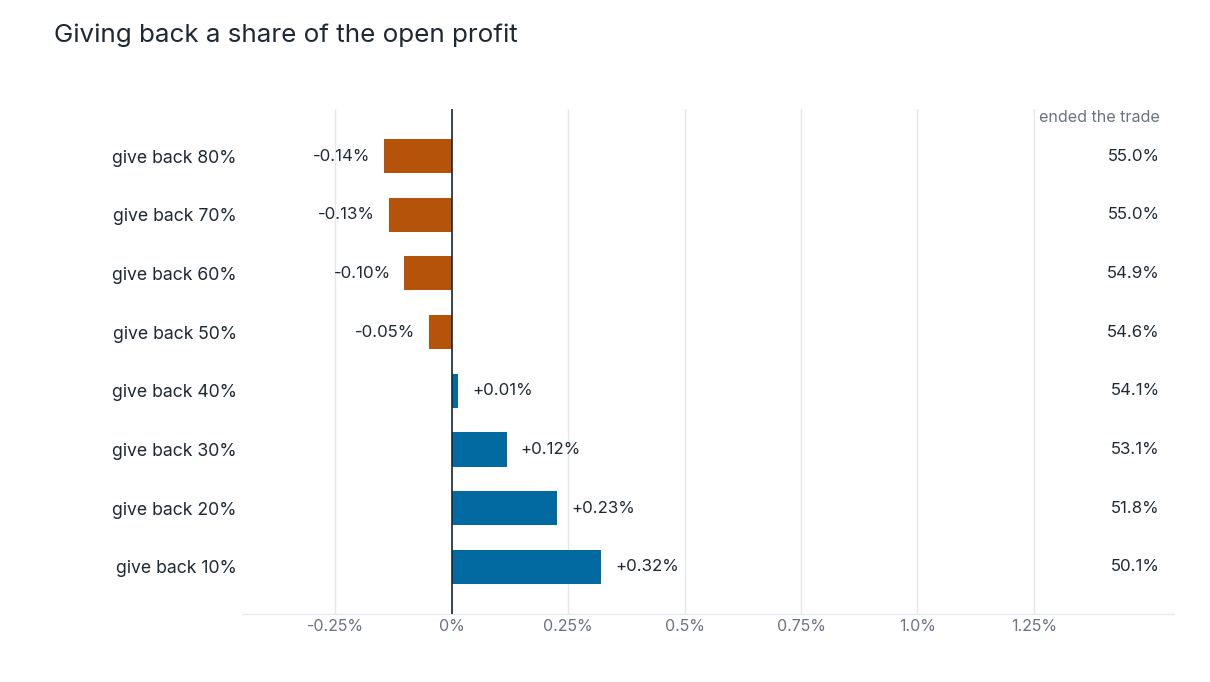
The rule that feels the most disciplined. Let the trade run, and once it is showing a profit, sell if it hands back a set share of that profit.
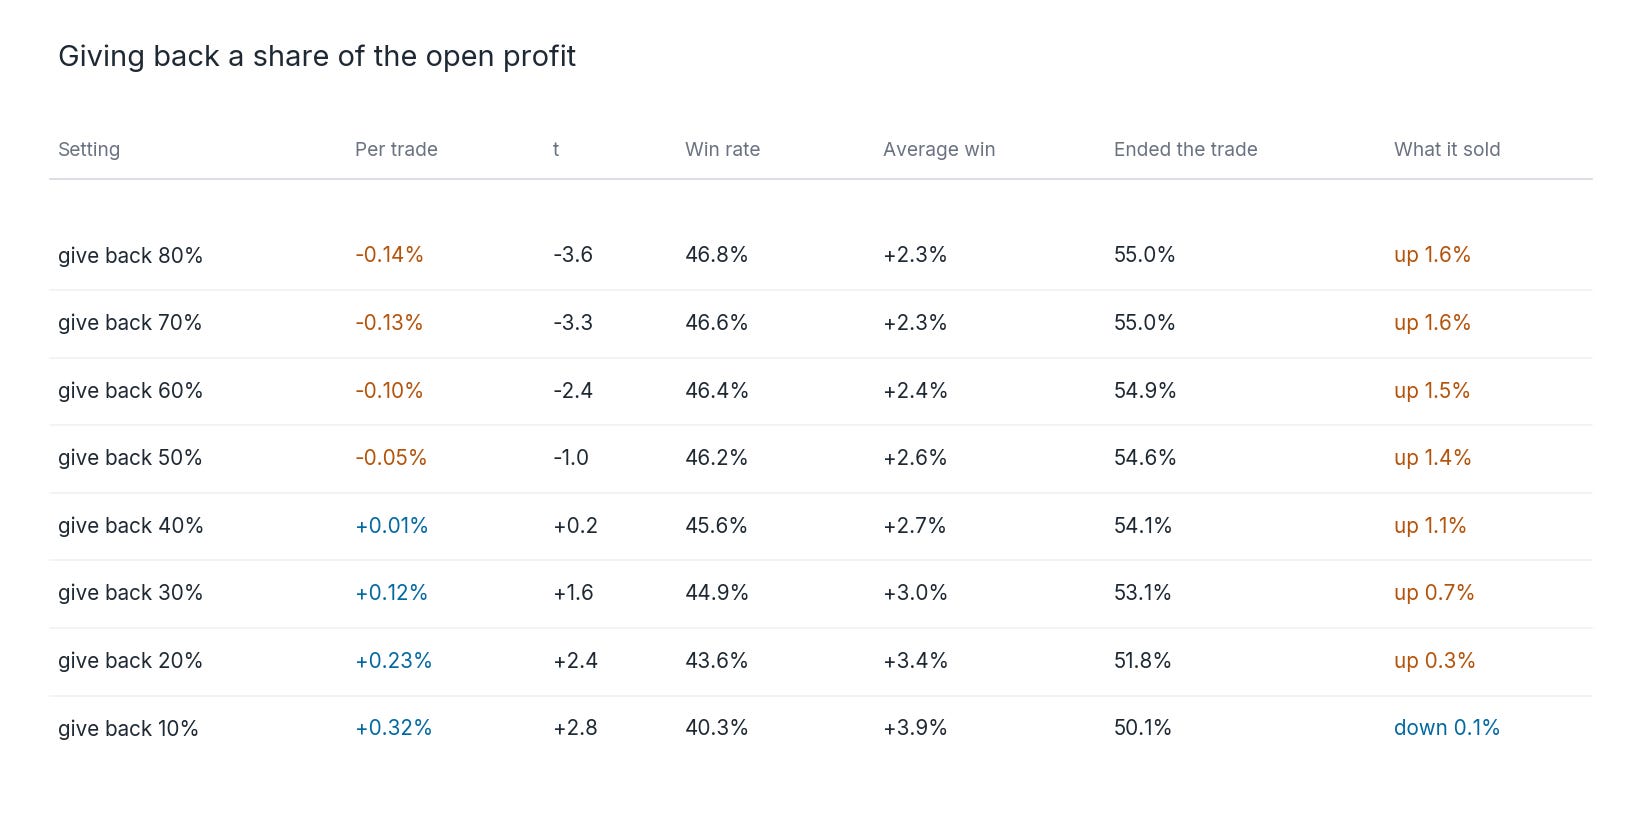
Its middle setting loses 0.02 percent per trade, the only family here that fails to make money at its own midpoint. At the tight end it loses 0.14 percent with a clustered t of -3.6, which is a real loss and not a rounding error.
Every table in this article has the same seven columns. Here is what each one is, once.
Setting is the number you would type into the rule.
Per trade is what the average trade earned across all 105,708 of them at that setting, after commission and slippage.
t is how confident you can be that the per trade number is real and not luck. Past +2 or below -2 is worth taking seriously. Anything between is noise.
Win rate is the share of those 105,708 trades that ended in profit.
Average win is how much the winning trades made, on average.
Ended the trade is how often this rule was the one that closed the position, instead of the 200-day exit doing it.
What it sold is where the position stood at the moment this rule fired. “up 1.6%” means the average position it sold was in profit.
Realtest code below:
Data:
	ma200:	Avg(C, 200)
Library:
	pkC:	HHV(C, BarsHeld)[1]
	// sell after handing back 80% of the open profit, armed only once in profit
	gbStop:	IF(pkC > FillPrice, FillPrice + (pkC - FillPrice) * 0.20, nan)
Strategy: yourStrategy
	EntrySetup:	C > ma200 and C[1] <= ma200[1]
	EntryTime:	NextOpen
	ExitRule:	C < ma200
	ExitTime:	NextOpen
	ExitStop:	gbStop
#7 The Close-Only Channel Sells Early and Sells Often
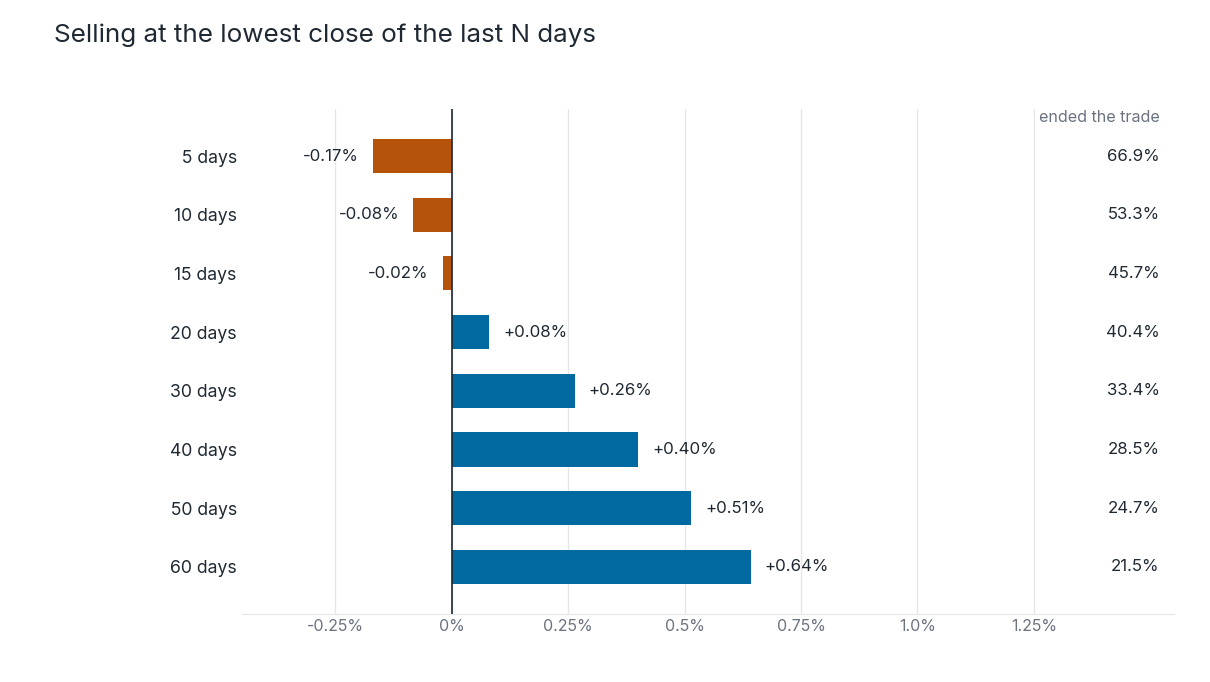
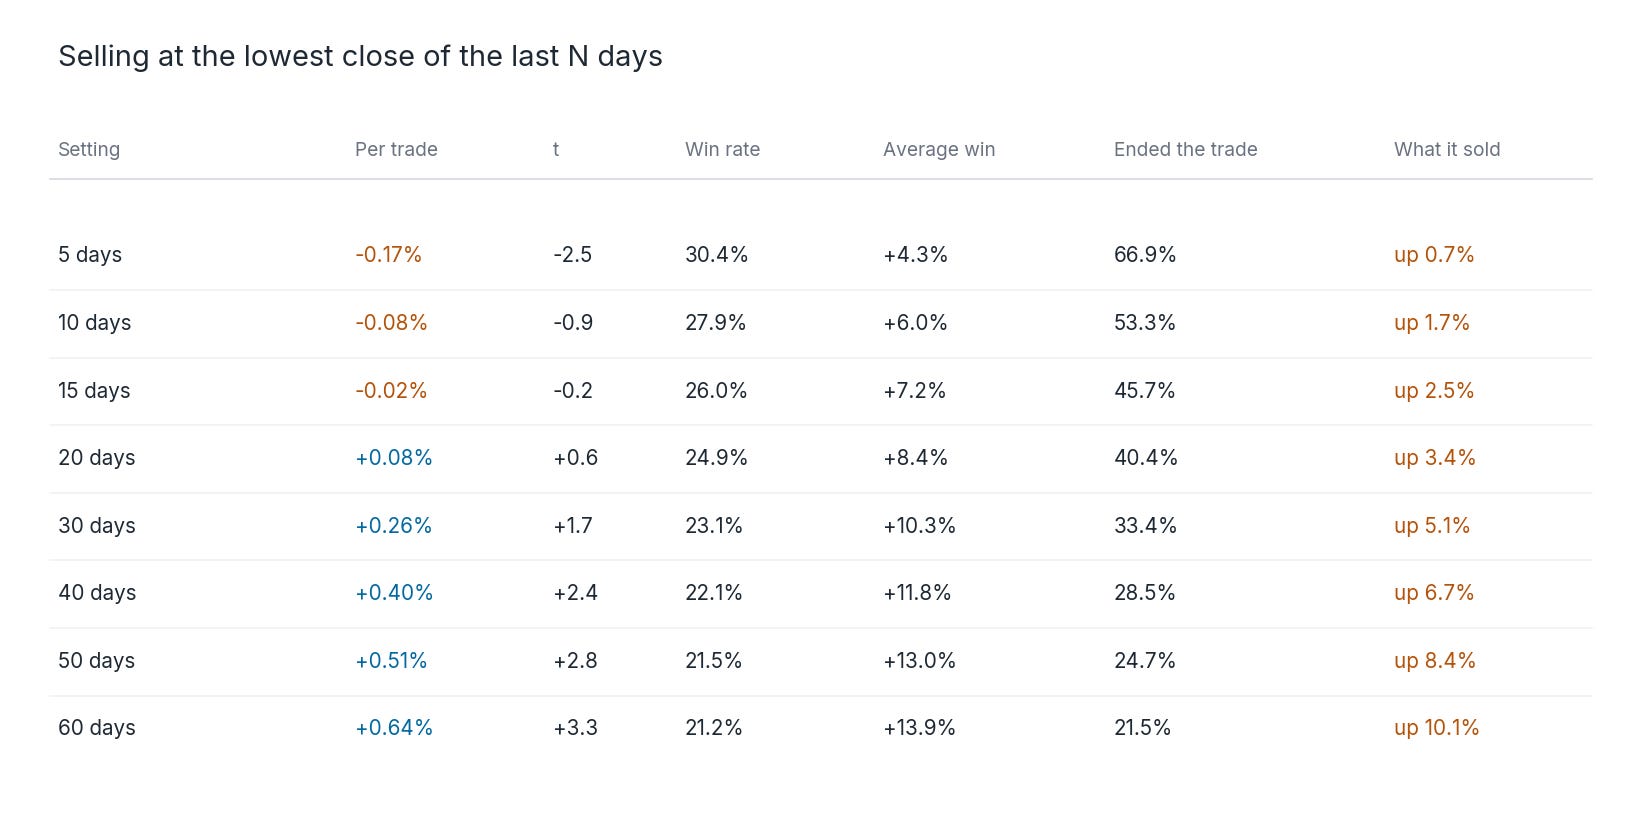
Sell when the stock closes at the lowest level it has closed at in the last so many days. The close-only version of the channel exit taught in most trend following books.
Middle setting, plus 0.17 percent per trade. The five-day version is the single worst cell in the entire test, minus 0.17 percent at a clustered t of -2.5, and it ends two thirds of all trades.
Data:
	ma200:	Avg(C, 200)
Library:
	// lowest close of the last 20 days, anchored one day back
	chanCls:	LLV(C, 20)[1]
Strategy: yourStrategy
	EntrySetup:	C > ma200 and C[1] <= ma200[1]
	EntryTime:	NextOpen
	ExitRule:	C < ma200
	ExitTime:	NextOpen
	ExitStop:	chanCls
#6 The Classic Donchian Low Beats the Close Version at Every Lookback
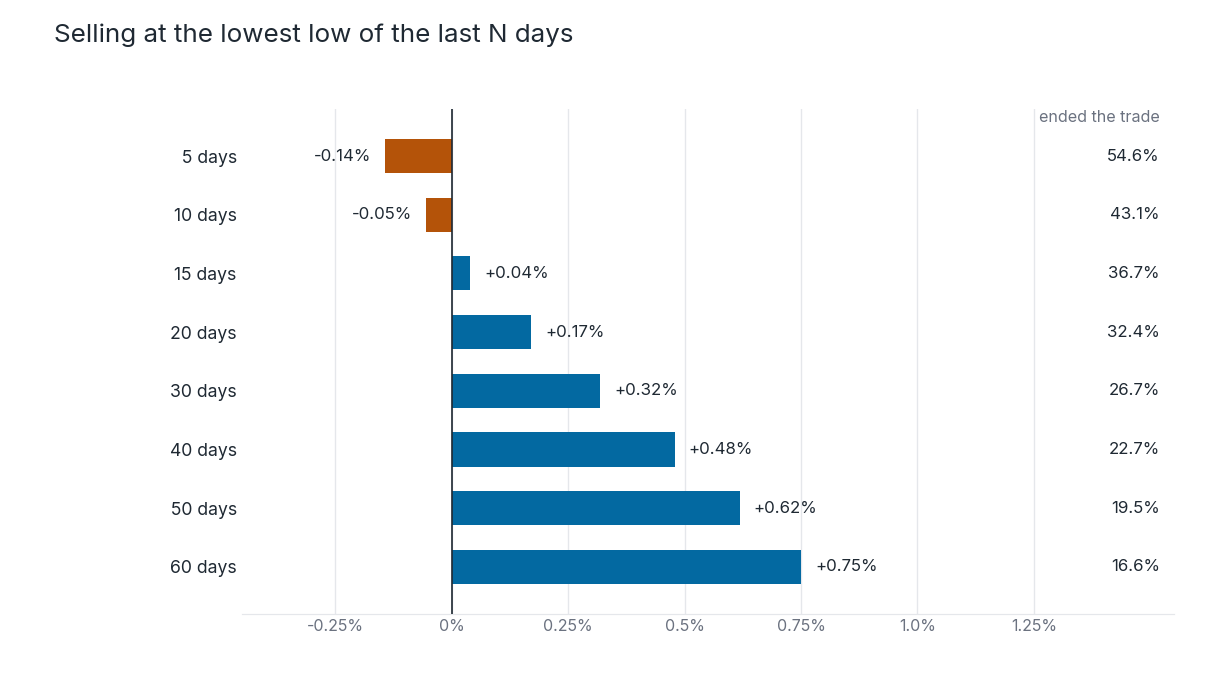
The same idea on intraday lows instead of closes. This is the exit in most published trend following systems.
Middle setting, plus 0.24 percent per trade, so it beats the close version at every lookback.
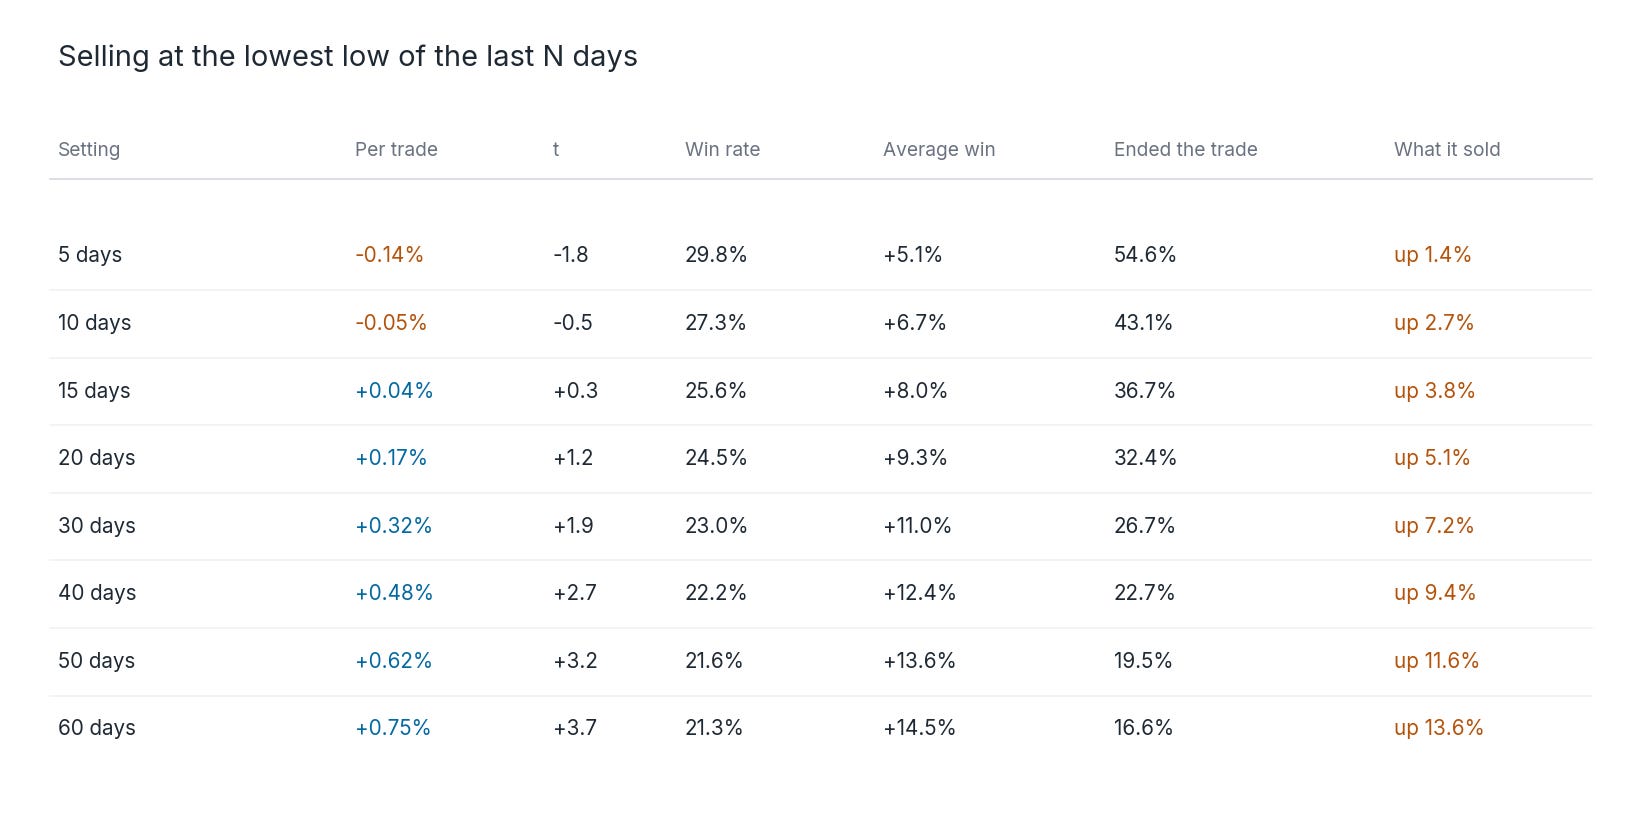
Both channel families say the same thing. Shorter lookback, more exits, less money. And the gap between using lows and using closes is worth roughly a tenth of a percent per trade at every setting, which is a wider gap than most people would guess for a one-word change.
Data:
	ma200:	Avg(C, 200)
Library:
	// lowest low of the last 20 days, anchored one day back
	chanLow:	LLV(L, 20)[1]
Strategy: yourStrategy
	EntrySetup:	C > ma200 and C[1] <= ma200[1]
	EntryTime:	NextOpen
	ExitRule:	C < ma200
	ExitTime:	NextOpen
	ExitStop:	chanLow
#5 The Blind Calendar Beats the Textbooks Without Looking at Price
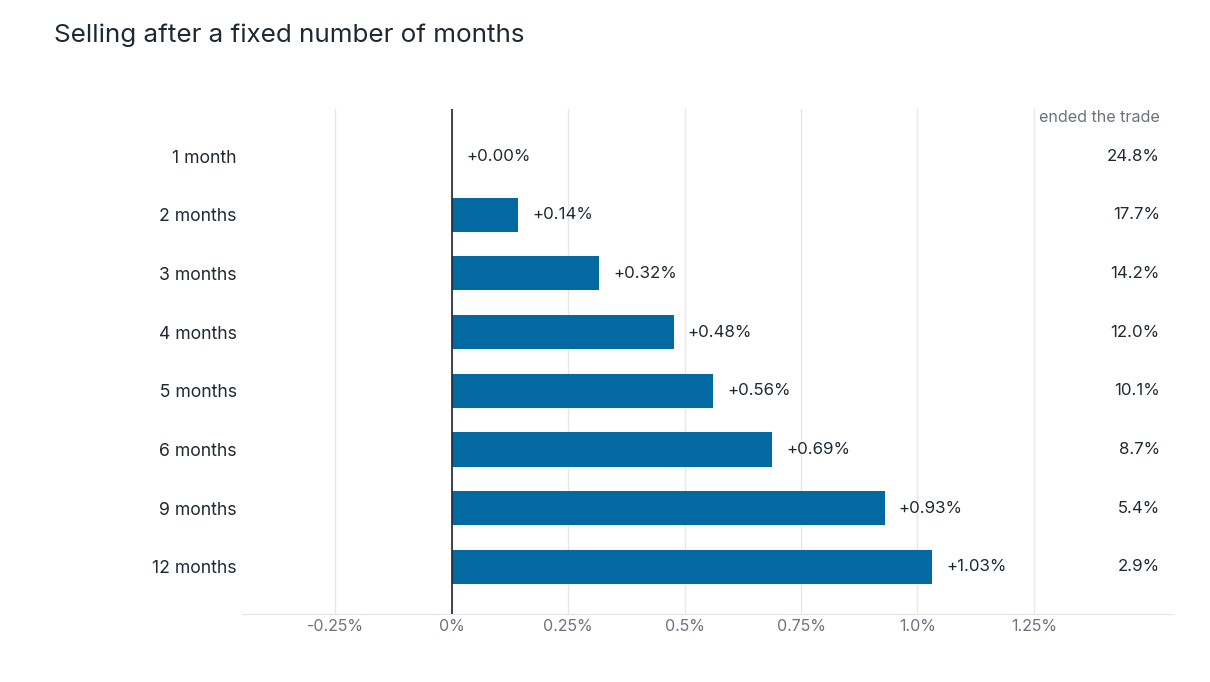
Sell after a fixed number of months, whatever the price has done. It does not know whether the stock doubled or halved.
This one is here as the control. Any exit that claims to read the market has to beat a rule that reads nothing at all.
Middle setting, plus 0.52 percent per trade. At twelve months it earns 1.03 percent, which beats every setting of both channel families above it.
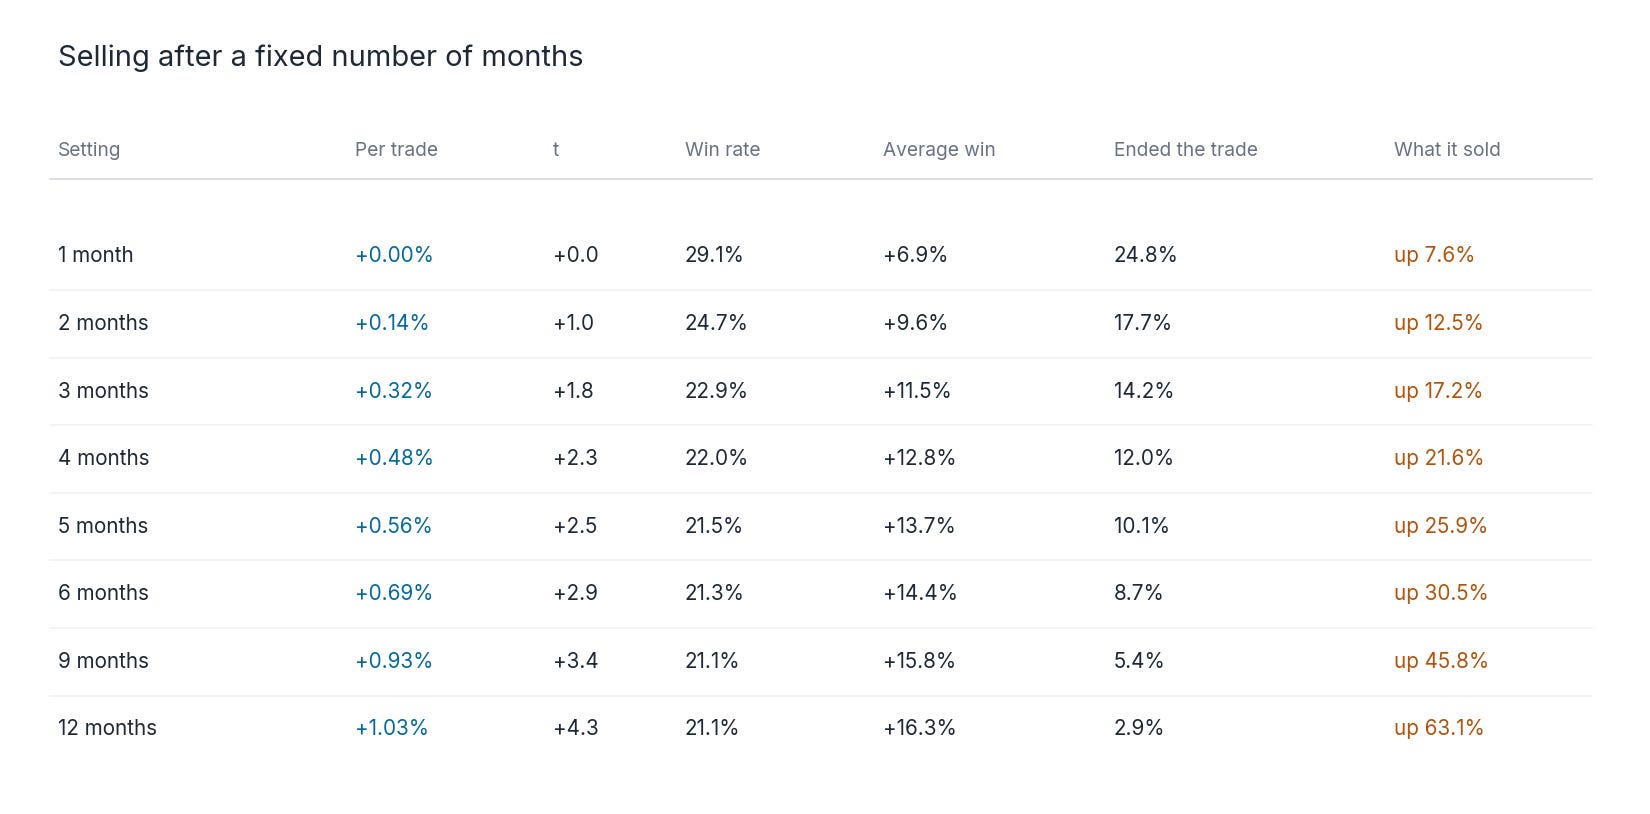
A calendar beat two exits that famous systems are built on. So whatever those two exits give you, seeing a trend end is not part of it.
Data:
	ma200:	Avg(C, 200)
Strategy: yourStrategy
	EntrySetup:	C > ma200 and C[1] <= ma200[1]
	EntryTime:	NextOpen
	// the time exit reads no price at all. The 200-day rule stays as the backstop
	ExitRule:	Select(C < ma200, "trend", BarsHeld >= 126, "time")
	ExitTime:	NextOpen

The Top 4 Exits and the Column That Changed How I Use Stops
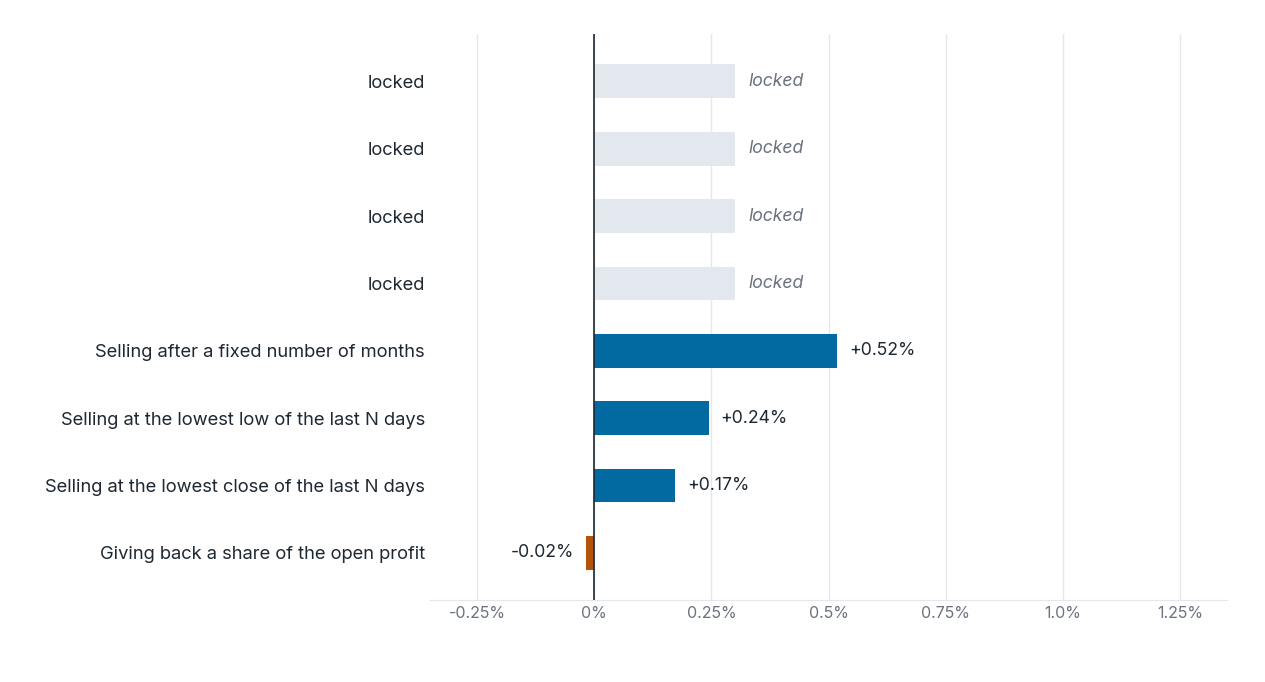
You have seen the worst four. Four to go.
Locked:
Both trailing stops, 8 settings each
Two more exits, including the one that finished first of all 57
The column that changed which stop I run
Every one with its ladder, win rate, what it sold, and the ExitStop line for RealTest.
Subscribe to unlock all four.