


The Engulfing Candle Dilemma
We are sharing some backtests on S&P 500 stocks, SPY, and Realtest code with you.

Should You Really Buy When the Close is Above the Previous High?
Conventional wisdom says yes. A close above the previous high is a bullish breakout, a sign that momentum is strong, and a green light for traders to jump in. But what if that’s actually the worst time to buy?
What if, instead of following the crowd, you flipped the script and buying when price close below the previous low and selling when it breaks above the previous high? Sounds uncomfortable…
That’s what we tested. Over 200,000 trades, real market data.
On one side, you’ve got the classic textbook play: a close above the previous high means bulls are in control, and the signal is clear enough that retail traders pile in. But pro traders know that once this move is large, the big players might already be offloading some positions. They say, “Sell into strength,” which means that what looks like a buy signal for the masses might actually be a profit-taking exit for the pros.
Let’s jump in…
Buy when the price closes below the previous low, and exit when it finally breaks above the previous high. Sounds counterintuitive, right?

But our tests tell a different story…
With over 200K trades analyzed for the “C > High[1] / exit if C < Low[1]” setup, the numbers were impressive, almost double the edge compared to the textbook approach.

Breaking Down the Numbers
We ran a series of backtests…
Sample Size: Over 200K trades for each variation.
Performance: The reverse strategy (buy on close below previous low, exit on close above previous high) consistently outperformed its counterpart in almost every risk metric.
The classic “buy when close > prev high” strategy tends to suffer when the market’s already roped in by retail traders, by that time, big players might be taking profits, leaving you with more losers than winners. Meanwhile, buying on a dip (when the close is below the previous low) forces you to take a risk that most traders psychologically avoid, yet over time, this risk premium pays off.
Breakout Strategy
We used SPY current & past data (Norgate Data) and included IBKR commissions.
Everyone’s used to the classic “buy when close > previous high” rule. But here’s where it gets interesting. We ran some tests where positions are entered as follows:
Entry: When the price closes above the 252-week high. And close > high[1].
Exit: When the price closes below the previous low (low[1]).

In the first test, the strategy started off making straight losses, the account got blown up pretty fast. We tried starting the strategy from different times, and it always ended up in the red.
Opposite Setup:
When a close > 252-week high happens in the last 1-3 days, then buy when the price closes below the previous low, and exit if it finally breaks above the previous high.

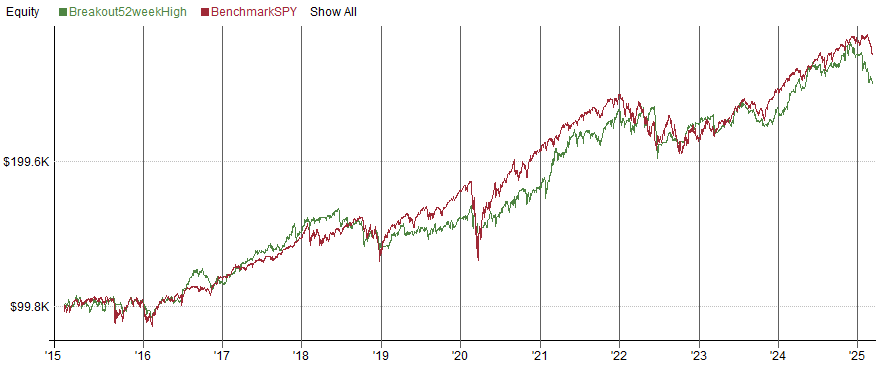
This approach held up much better and even outperformed SPY. Sharp ratio = 0.94, Mar ratio = 0.69 and ROR 15% and drawdown 22%.
Backtest over the last 10 years.

During periods of high volatility, markets can drop significantly, and if we're waiting for a close above the previous high to exit, we might not get out in time. Perhaps that's why this edge exists, it's too risky to buy falling stocks, but over the long term, you actually make more money.
Psychological Drivers of Contrarian Edge

The disparity in performance stems from retail trader behavior and institutional dynamics:
Retail Herding and FOMO:
Retail traders often chase bullish momentum (c > h1), creating crowded long positions. Institutions may exploit this by taking profits, leading to false breakouts.
Bearish engulfing (c < l1) triggers fear, causing retail traders to panic-sell. Contrarian entries here capitalize on oversold conditions and institutional buying.
Risk Aversion and Mental Fatigue:
The contrarian strategy requires holding positions during volatility, which aligns with asymmetric risk-reward profiles (higher win rates but longer drawdowns).
Retail traders often abandon contrarian trades prematurely due to psychological discomfort, leaving edges unexploited.
Institutional Profit-Taking:
Pro traders sell into strength (bullish engulfing) to lock in profits, while buying during dips (bearish engulfing) to accumulate positions. This institutional activity creates mean-reversion tendencies that the contrarian strategy can exploit.
SPY
We applied the reverse method on SPY with historical data. The equity curve was consistently stronger when buying on close < prev low, especially over the long haul.


Realtest code…

You can copy this SPY Realtest code: HERE
It’s free. Do your own tests and explore this idea further.
Final Thoughts
Engulfing candle patterns aren’t just about simple textbook entries. They’re about understanding market psychology and the interplay between retail noise and pro order flow. The traditional “close > prev high” rule might be the common and logical play, but the reverse strategy, buying on a close below the previous low could be where the edge hides, especially if you’re comfortable taking on that risk premium.
The takeaway? Don’t be afraid to question conventional wisdom. Big players have a way of turning the obvious into an overhyped signal, so sometimes, the contrarian approach pays off. As always, test these ideas on a large sample size, factor in realistic commissions, and align your trades with a solid trend filter.
Feel free to drop your thoughts or hit me up if you want to dive deeper into this strategy.
Let’s disrupt the market together!
Nice write up! Thank you!
Is the code also for tradestation?