

I Tested 5 "Buy The Dip" Candle Patterns on SPY: This One Generated $551,302.
We tested 5 classic candlestick patterns. Only one survived the 2008 and 2022 bear markets. Here is the code:

New to SetupAlpha?
Join independent systematic traders and explore our full library of 60+ research articles and RealTest code snippets before reading today’s research.
Hey,
Most quantitative traders absolutely hate candlestick patterns.
They will tell you it’s just an arbitrary ratio of price and time drawn on a screen, and the market doesn’t care where a random 24-hour window happens to close.
They aren’t entirely wrong.
But as systematic traders, we have to be intellectually honest. We cannot dismiss an idea just because it sounds unscientific.
We test everything, because edge is often found in the exact places where the smartest people in the room refuse to look.
Everyone loves to “buy the dip” on the S&P 500. The logic is intuitive. When the market drops, it usually bounces back.
This is the foundation of mean-reversion trading. But when you actually take the most famous candlestick patterns from trading textbooks and test them over thousands of real market days, the data reveals a surprising truth.
Many of them simply do not work. They might look perfect in hindsight on a single chart, but they fall apart when tested systematically.
To prove this, I took 5 of the most common “Buy the Dip” candlestick patterns and ran them through RealTest on SPY.
The Rules of the Test:
Instrument: SPY
Timeframe: 2000 - 2026 (Includes the Dot-com crash, 2008 Financial Crisis, 2020 COVID crash, and the 2022 bear market).
Capital Allocation: 100% of equity per trade (No leverage).
Exit Rule: Extremely simple. Exit when the close is higher than yesterday’s close (
C > C[1]).Friction: Realistic slippage included (0.0001 * FillPrice).
I didn’t use any magic moving averages or complex trailing stops. I wanted to see the raw, unfiltered edge of the candlestick pattern itself.

The Losers and Why Popular Patterns Fail
Before we look at the winning pattern, let’s look at the ones that disappointed.
In trading, our ultimate goal is to beat the benchmark. The benchmark simply means buying the S&P 500 and holding it forever, doing absolutely nothing. If our active trading strategy makes less money than just holding the index, we are taking on extra work, taxes, and stress for no reason.
If you are trading these common patterns manually, you are likely losing to the benchmark.
Bearish Engulfing Candle
Rule:
close < low[1] and High > High[1]Win Rate: 66.51%
Max Drawdown: -17.61%
Annual Return (CAR): 1.54%
Net Profit: $46,203
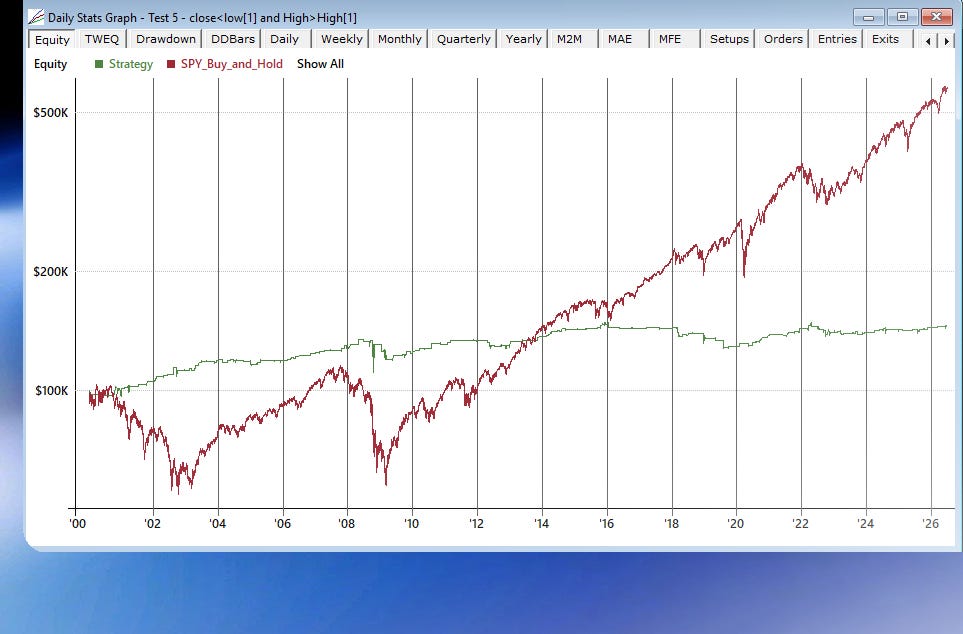
This pattern looks for a specific moment of indecision followed by a breakout. On paper, it sounds incredibly safe, and the 66% win rate confirms that. But there is a major problem. Because these perfect setups are so rare, the strategy barely trades. Over 26 years, the annual return is a pathetic 1.5%. You would have made significantly more money just leaving your cash in a basic savings account. A high win rate means nothing if the strategy doesn’t generate actual wealth.
The Standard “Close Below Low”
Rule:
Close < Low[1]Win Rate: 61.10%
Max Drawdown: -32.36%
Annual Return (CAR): 3.67%
Net Profit: $153,175
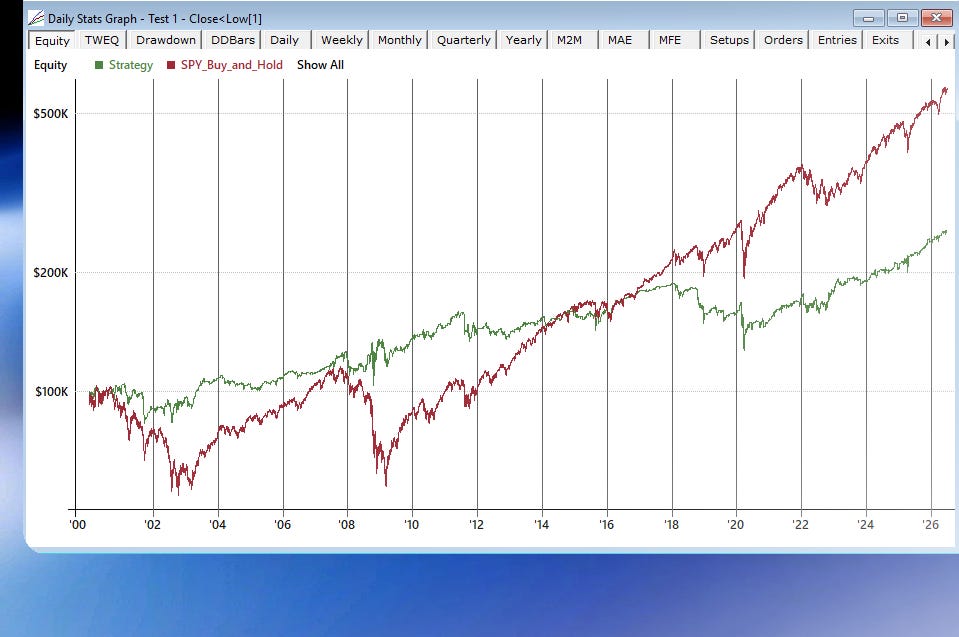
You buy when today’s close is lower than yesterday’s lowest point. It is the definition of catching a falling knife. Over 1,000 trades, it generated a decent win rate. But the annual return is still under 4%, and you had to sit through a painful -32% drawdown. It completely fails to beat the SPY buy-and-hold benchmark.
The Weekly “Close Below Low”
Rule:
Extern(~Weekly, c < l[1])Win Rate: 64.13%
Max Drawdown: -31.56%
Annual Return (CAR): 4.50%
Net Profit: $228,975
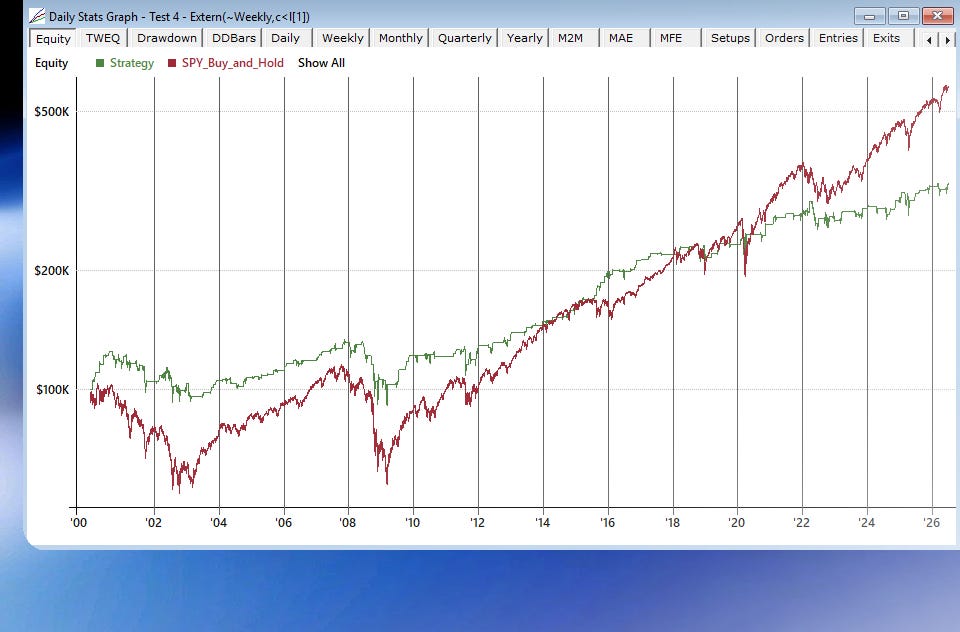
Many traders think that simply moving to a higher timeframe automatically fixes a bad strategy. So we tested the exact same logic as ”Close Below Low”, but on a weekly chart. The results improved slightly (the win rate jumped to 64% and profit increased), but it is still fundamentally weak. A 4.5% annual return is simply not worth your time or risk.

The Shift from Mediocre to Highly Profitable
Most traders stop here. They test a few daily candlestick patterns, see mediocre returns, and assume that systematic trading doesn’t work.
But there is a twist because when you stop looking at the standard daily noise and change what kind of close you are measuring, the profitability skyrockets.
Two of the patterns I tested completely blew the others out of the water. One of them generated an incredible $551,302 in net profit, effectively challenging the beloved buy-and-hold approach on a risk-adjusted basis.
Let’s look at the exact rules for the two winning candlestick patterns, the performance data, and the full RealTest code so you can run it yourself.