How to Identify Top-Performing Small-Cap Stocks (Using Research-Backed Criteria)
Proven Principles for Choosing Small-Cap Stocks. Backed by Real Evidence.

Hello, Recently, I tested different methods to identify which small-cap stocks consistently outperform large caps.
I used 25 years of US stock data and drew on the latest research to uncover the most effective approaches.
Findings reveal a new way to think about selecting small-cap stocks.
Here’s what you’ll learn in this article:
Why the small-cap works the best during specific market conditions (and how to identify them)
Why small caps have better risk profiles than large caps (this contradicts everything you’ve heard)
Full strategy + rules + RealTest code
I’m going to show you the papers I read, the tests I ran, and the exact screening method I discovered.
This is part one of a series. By the end, you’ll have a complete, tested method for small-cap selection. First, I’ll show you the common selection mistake, and how to correct it with a professional approach.

The Small-Cap Premium Is a Myth (Sort Of)
Small caps outperform only in specific market cycles, analysis shows exactly when to target them for maximum edge.
Here’s what the data shows:
Source: https://papers.ssrn.com/sol3/papers.cfm?abstract_id=1937396
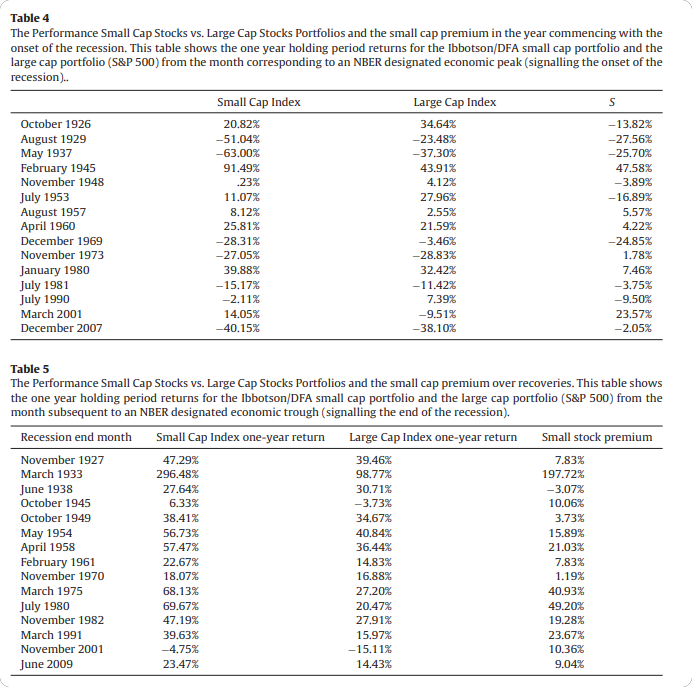
This table shows how small companies compare to big companies during big drops in the market. The pattern is: small stocks beat big stocks in the year after a recession, but they fall behind before the market reaches its highest point.
The small-cap edge exists, but it’s concentrated in specific market regimes. Timing is crucial, owning small caps outside optimal periods exposes you to higher volatility without the reward.

Wrong Size Measuring
While most investors rely on market cap alone to pick small stocks, my research-backed method leverages superior liquidity signals for better results.
I found this paper (https://arxiv.org/pdf/1708.00644) that argues market cap isn’t the best measure for the size effect. The authors tested average daily dollar turnover (ADV) as a more reliable metric. Dollar turnover = close price × volume.

Why does this matter? Because for trading, liquidity is more important than company size. A $500M company with heavy trading volume behaves differently than a $500M company with no liquidity.

I Ranked 3,000 Stocks By Dollar Volume
I took all Russell 3000 stocks and ranked them by close × volume (averaged over 20 days).
Then I split them into groups and measured skewness.
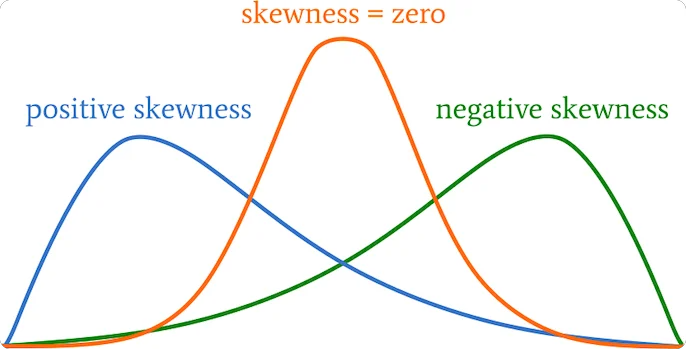
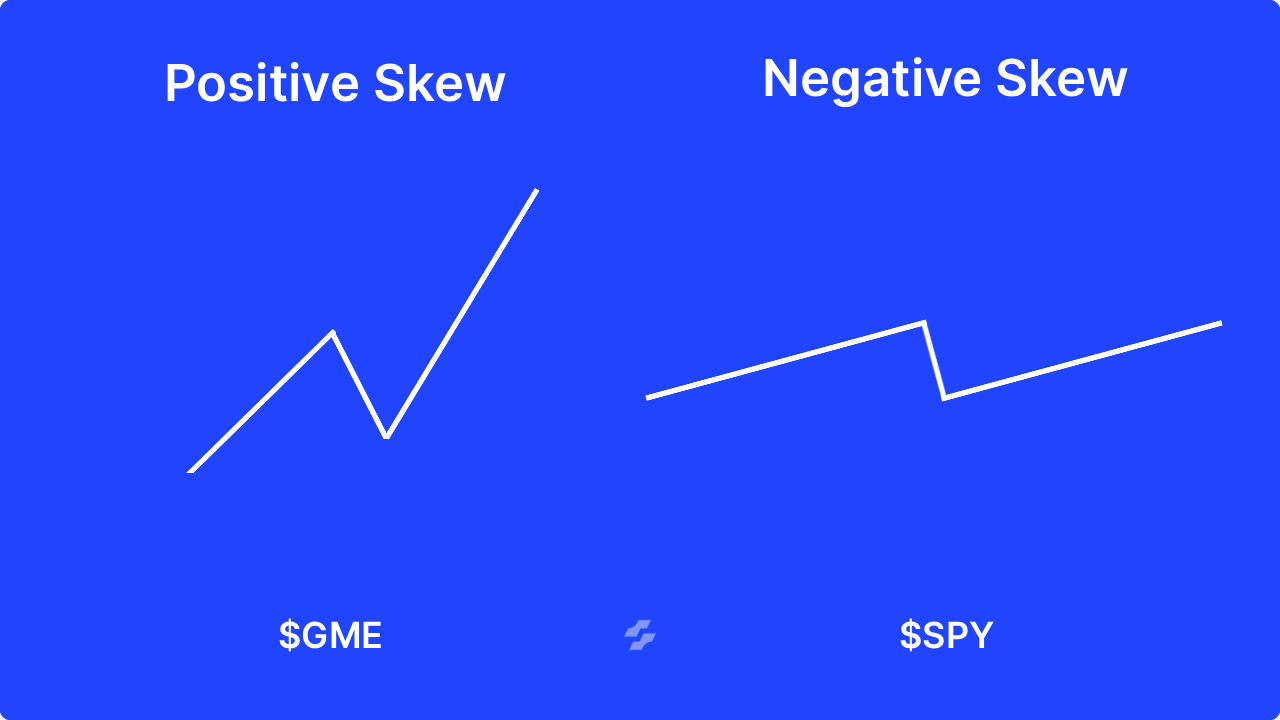
What is a Skew? Skewness tells us if a stock tends to have big jumps up or down. If skewness is positive, the stock moves up more than down. If it’s negative, there are more big drops than gains.
Contrary to common belief, academic papers skewness analysis proves that small caps offer superior upside potential while large caps bear the real downside risks.

Source: https://arxiv.org/pdf/1708.00644
This chart shows skewness declining as you move from small to large stocks (ranked by both market cap and ADV). The smaller the stock by dollar volume, the higher the positive skewness.
Small caps have better upside potential relative to downside risk than large caps. The extreme risks come from the large-cap side, not small caps.

I Tested It On Real Price Data
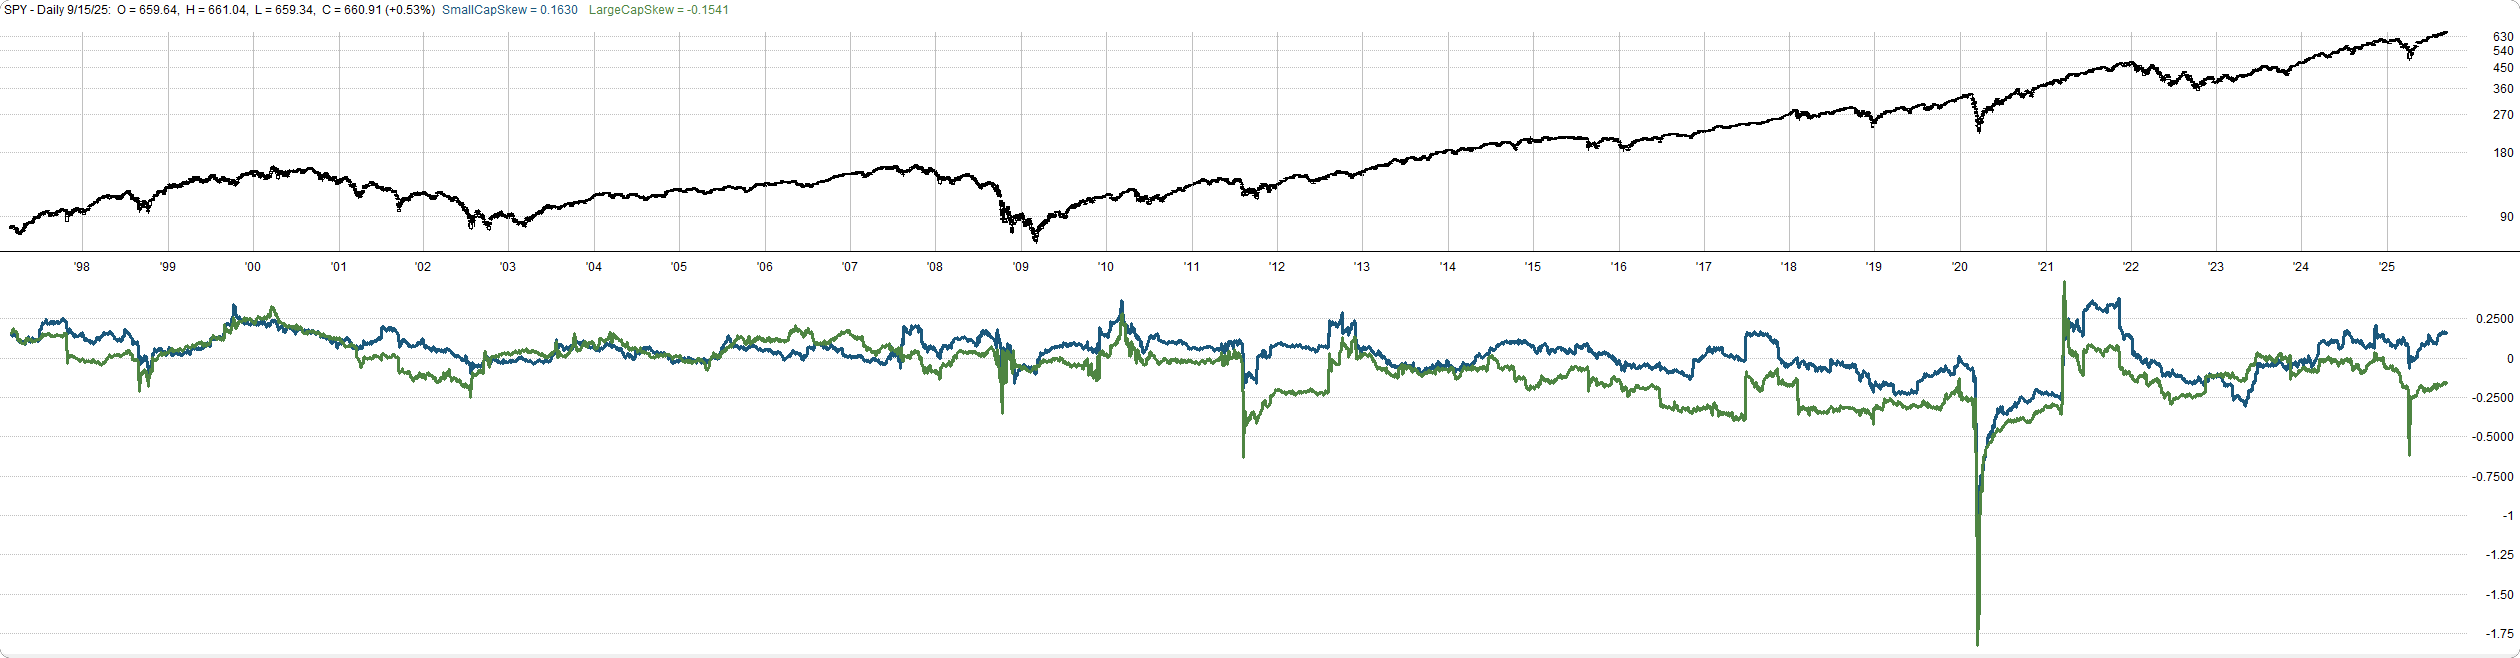
I validated this using daily price data for all Russell 3000 stocks over the past year.
Blue line is small-cap stocks (Russell 3000 without S&P 500 and Nasdaq 100 symbols). Green line is S&P 500 large caps only.
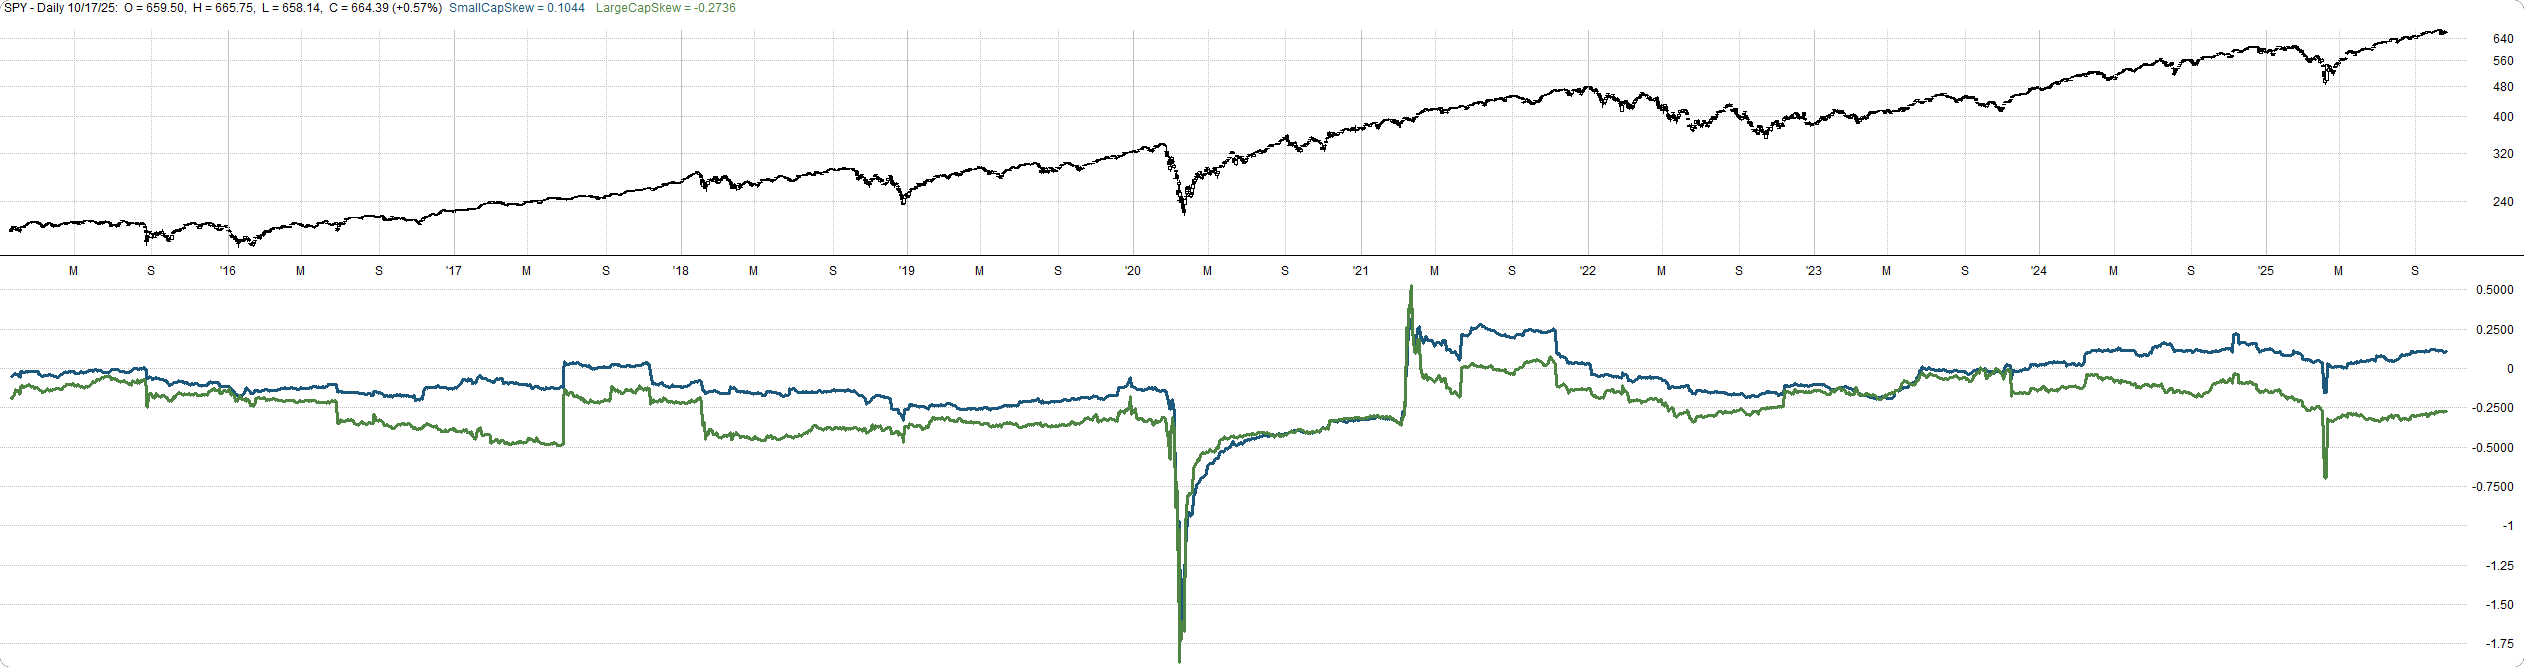
Small-cap skew stays consistently higher than large-cap skew. This pattern holds across different lookback windows.
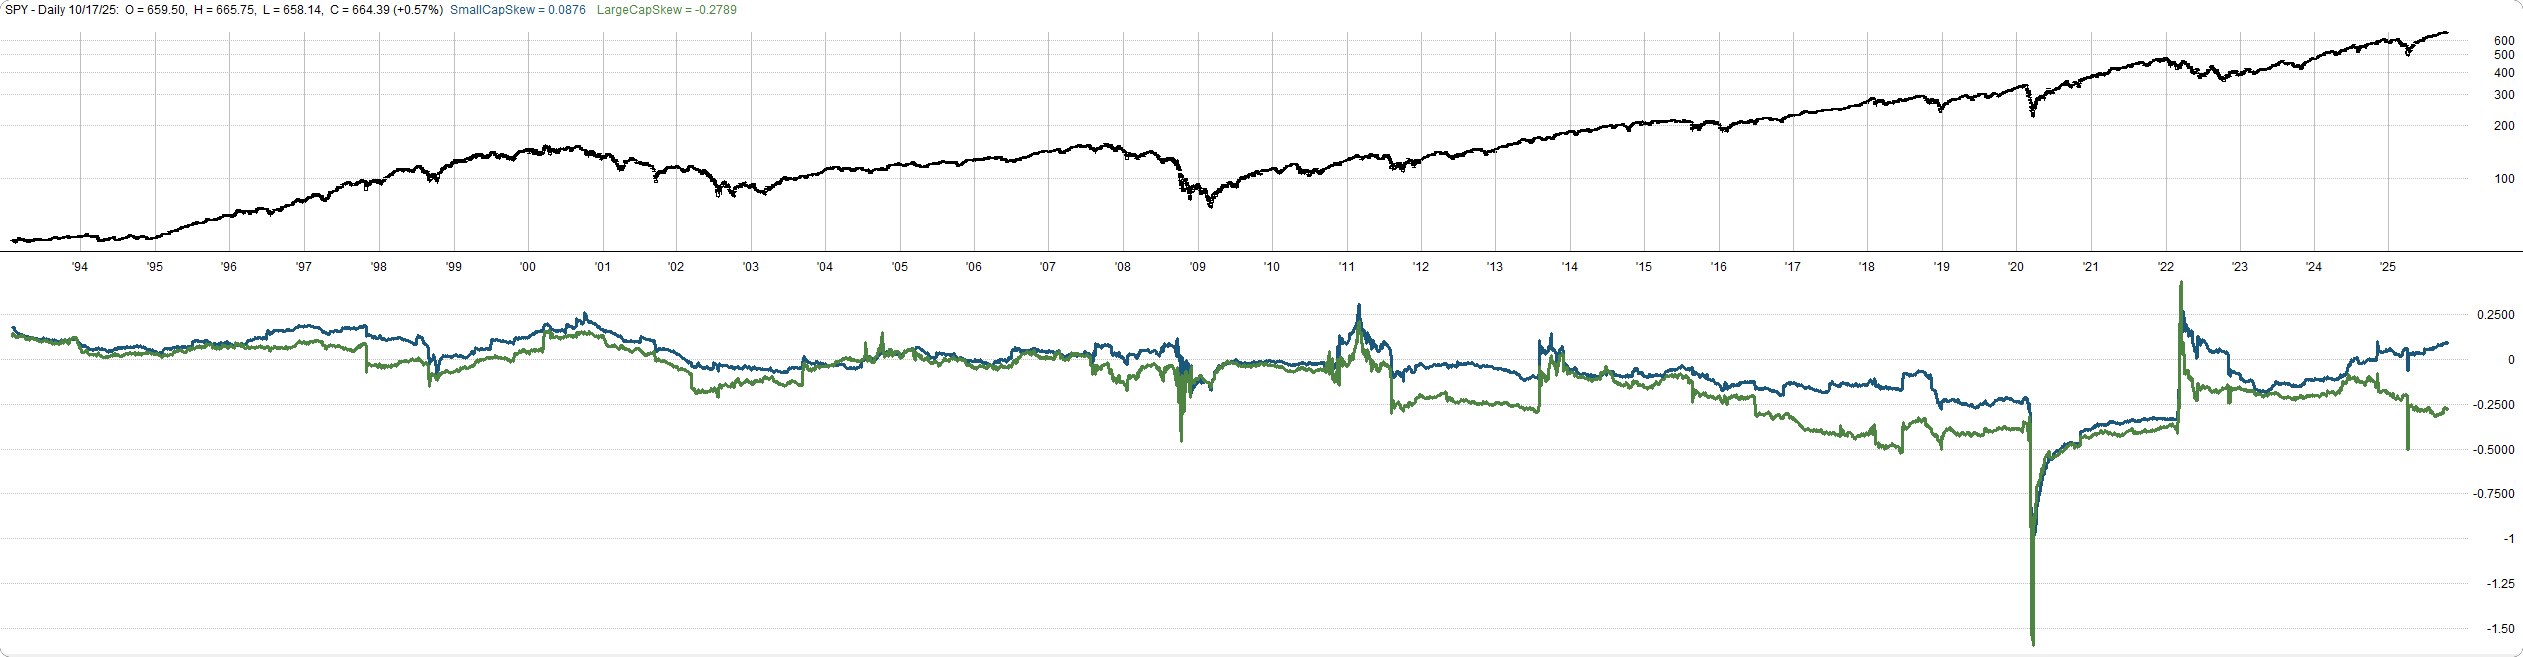
Here’s the 500-day historical skew. Same story. Small caps maintain positive skew even through volatile periods.

Next Test: Ranking By Dollar Volume
I ranked all Russell 3000 stocks by close × volume from 0 to 100.
Blue line is the bottom 0-30 percentile (lowest dollar volume).
Green line is the top 70-100 percentile (highest dollar volume, large caps).
Lower dollar volume stocks have more positive skew than higher dollar volume stocks.
Here’s the extreme comparison. Blue line is the lowest 10 percentile by dollar volume. Green line is the top 10 percentile (large caps).
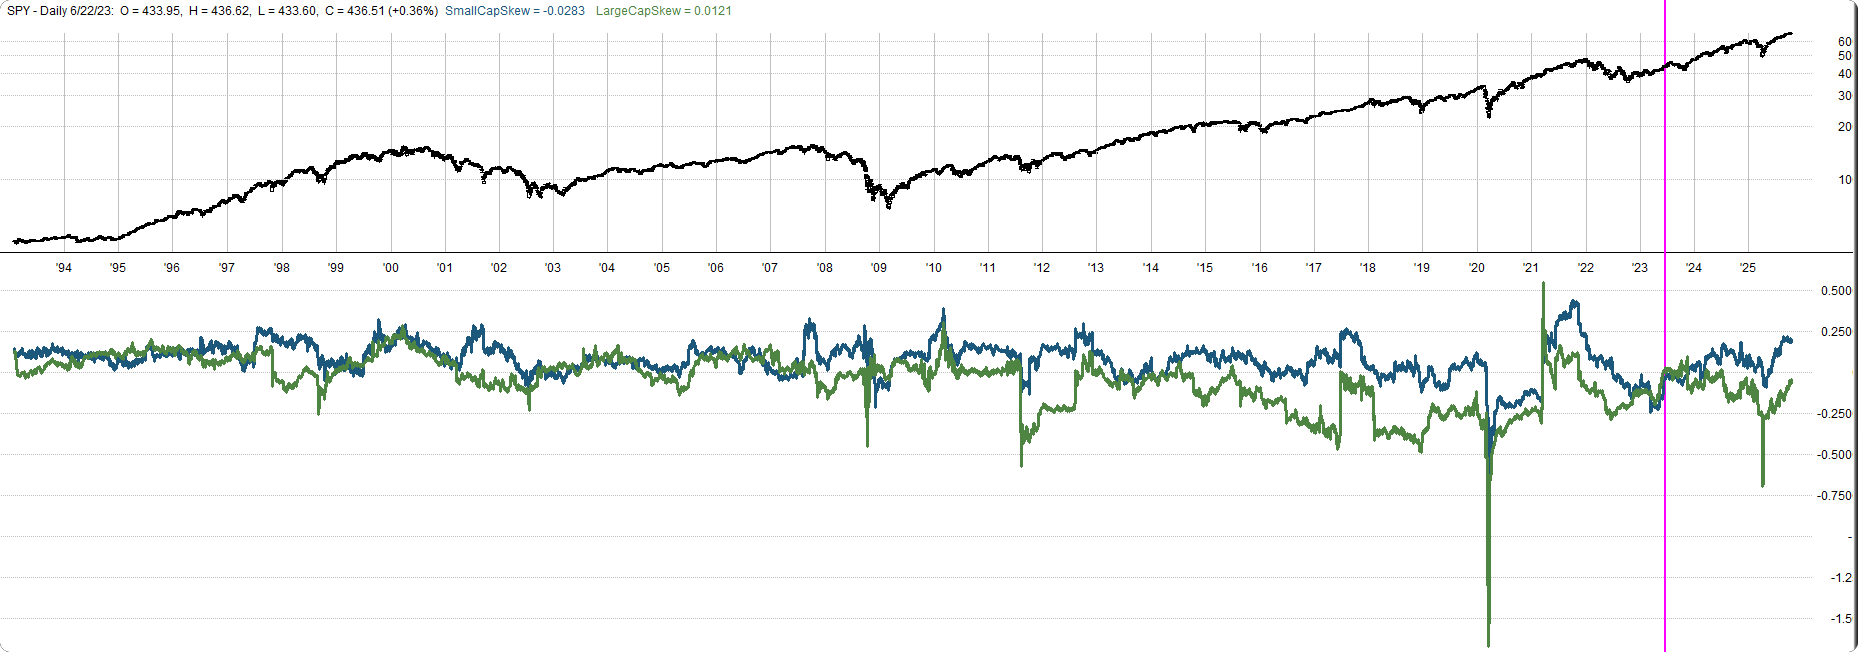
Small caps with low average daily volume consistently show positive skew, while large caps display neutral or negative skew.

The Backtest: Does This Translate To Returns?
I tested a simple SMA crossover strategy. I ran two versions:
Top 100 highest dollar volume stocks (large caps)
Bottom 100 lowest dollar volume stocks (small caps)
Top 20% ADV stocks (large caps):

Total trades: 27,014. Solid performance, but look at the next test.
Bottom 20% ADV stocks (small caps):
Total trades: 30,518. While volatility is higher, risk-adjusted returns improve across nearly every metric for these strategies.

The bottom 20% has higher average wins, lower average losses, and better drawdown profiles.
Strategy Rules + RealTest Code is below.

When To Focus On Small Caps VS Large Caps
It’s tactical edge, timing matters.
Small caps outperform in the year after an economic trough. In the year before a business cycle peak, small caps lag. Small stocks bounce back more quickly after big market drops. But when the market has already gone up a lot, it’s better to focus on bigger companies.

Source: https://www.lseg.com/content/dam/ftse-russell/en_us/documents/research/original-us-small-caps.pdf
This chart shows how the dividing line between large-cap and small-cap has grown over the years. The annual cutoff for Russell 1000 (large) vs Russell 2000 (small) keeps moving higher. This is why fixed market cap thresholds lose effectiveness. Dollar volume is dynamic and evolves with the market, keeping your strategy robust.

What You Should Do
Based on these findings, here’s how you can adapt your trading immediately:
For long-term, fundamental strategies: use market cap with an ADR filter (like rotation systems)
For short-term, liquidity-driven strategies: use dollar volume ranking (like breakout strategies)
Track macro signals before changing allocations (GDP, employment, credit spreads, business sentiment)
Focus on small caps after recession troughs, favor value stocks within small caps
Rotate between small/large as macro regime changes
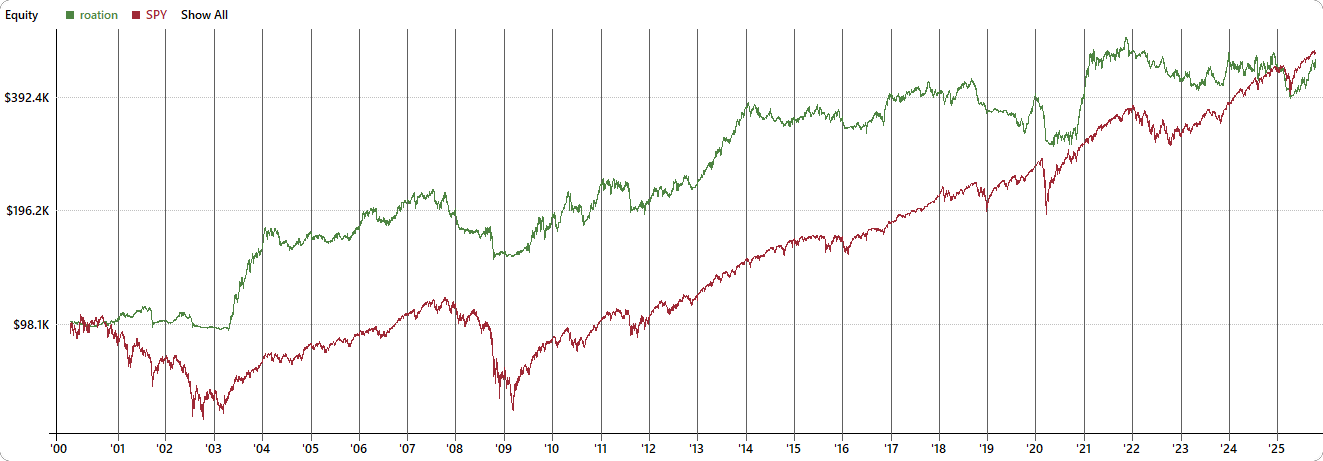
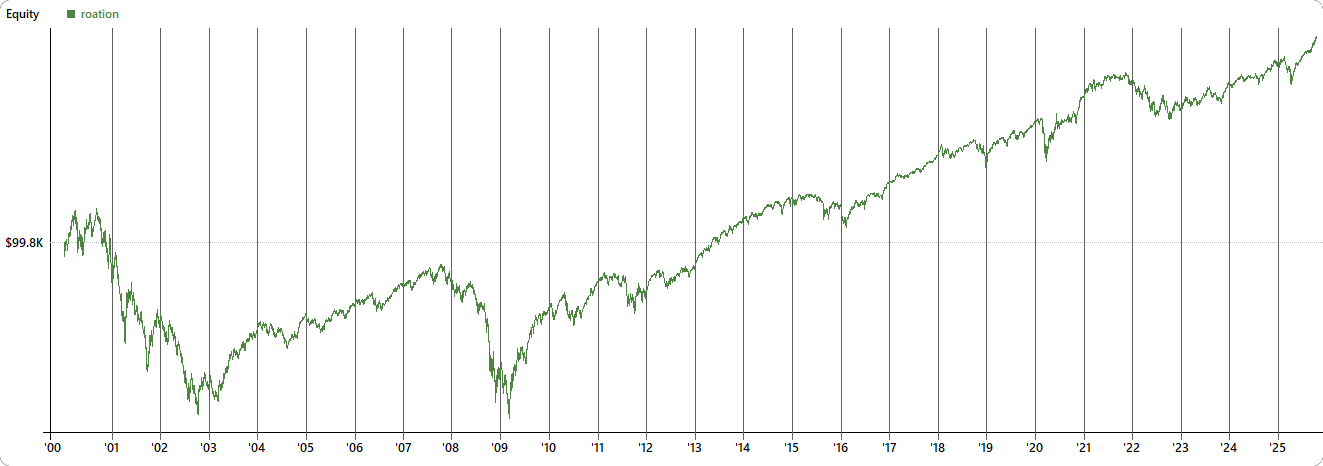
Here’s the equity curve comparison for the top 20% ADV vs bottom 20% ADV.
If ADV > 80% buy and exit end of the month. Repeat every month. Total of 27.014 trades.
If ADV < 20% buy and exit end of the month. Repeat every month. Total of 30,518 trades.
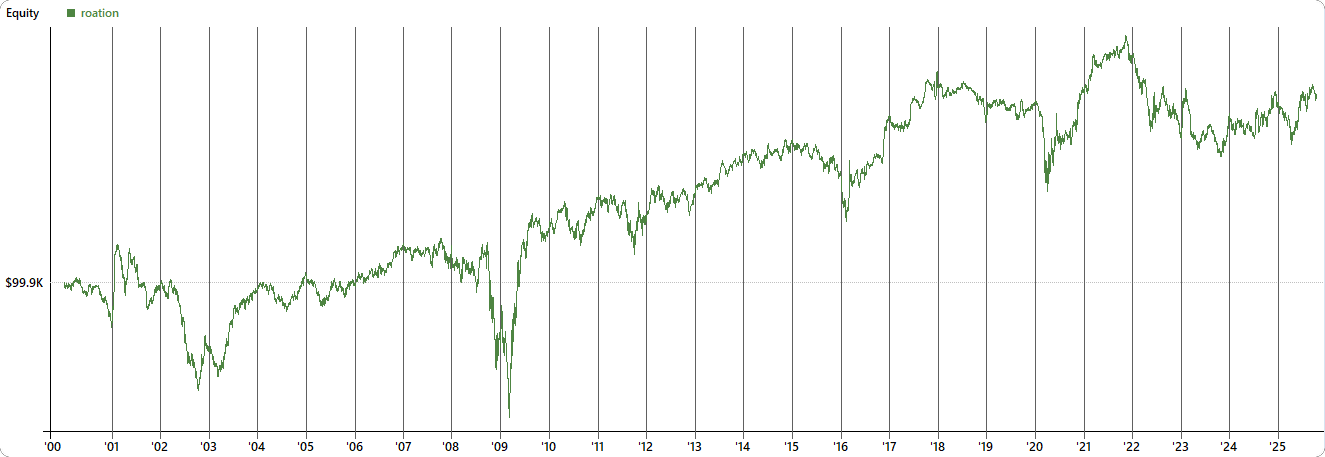
After major crashes we can see the smaller ADV make higher % gains.

The Next Problem: Fake Breakouts
Now we know how to find the best small-cap candidates using dollar volume ranking instead of market cap.
But here’s a new problem: Smaller stocks are easier to manipulate. They show better breakout patterns, but many.. many are false signals. This problem is growing because of the rise of social media and AI.
How do you avoid buying manipulated breakouts and becoming the victim of a false move?
In the next article, I’ll show you
How common false breakouts really are
How to avoid false breakouts
Why they happen
What pump-and-dump schemes are.
I’ll also explain how to identify the right breakouts to buy.
This series will deliver a complete, actionable small-cap selection blueprint. To start, I’ll show you how top professionals reliably identify these stocks.
Subscribe now so you don’t miss it.
Get Strategy Rules + RealTest Code Below!