Satellite photos that count cars in Walmart parking lots before the earnings call.
Credit card panels that see a retailer’s quarter weeks before the market does.
These edges are real. Funds pay for them precisely because they work.
That is also the problem:
The vendors do not even list prices.
You book a sales call, and the quote comes back per year, per seat, written for funds.
A $30,000 data bill on a $50,000 account needs a 60% return just to pay for itself.
Nothing returns 60% reliably.
So this article has one admission rule. Everything in it you can start testing this week, with data that costs nothing (free).
That rule cuts less than you would think, because the law forces a lot of information into the open. An insider who buys his own stock has two business days to tell the SEC. A federal agency that signs a contract has to publish it. The disclosures land within days.
The market often takes months to fully read them.
That gap is the disclosure lag, and this article lives inside it.
Five edges, all free, one with Python code you can run today in a free Colab notebook.
1. Government contracts (the one with code)
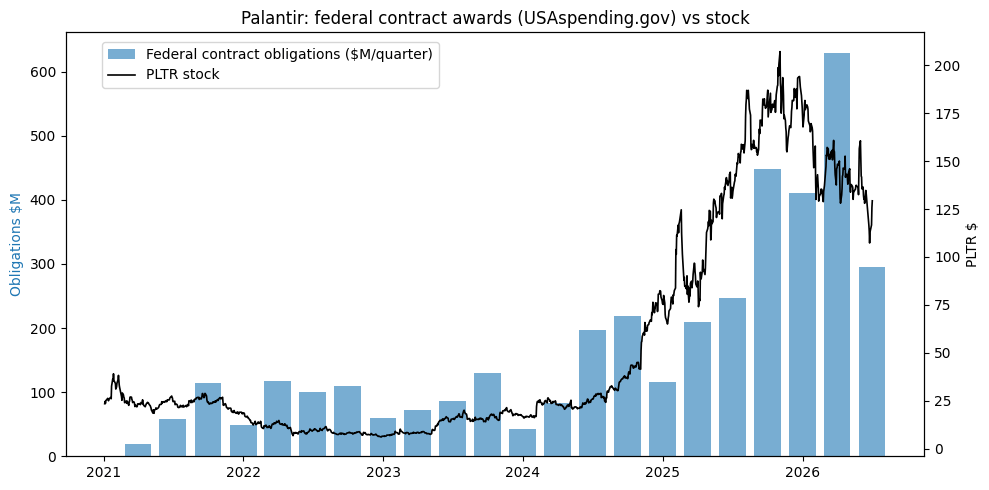
Here is a chart I built this week with about 30 lines of Python.
Palantir federal contract obligations vs PLTR stock
The blue bars are federal contract money awarded to Palantir each quarter, straight from USAspending.gov. The black line is the stock.
Look at 2024.
For three years the bars sat mostly between $40M and $130M per quarter.
Then the quarter ending June 2024 printed $198M.
The next two years were lumpy, $219M one quarter, $116M another, but the floor had moved $448M by late 2025, $630M by early 2026.
Anyone watching this table saw the government business explode, quarter by quarter, in a free public database.
The stock’s big run started after the bars broke out.
Why does this edge exist? Because a federal contract award appears on USAspending.gov within days, but the revenue from it shows up in an earnings report months later. You are reading the company’s order book before the quarterly filing confirms it.
To be fair to the market, Palantir’s rally had a lot of AI story in it too, not just contracts. That is exactly why this works better in boring names. LMT has 25 analysts reading everything. A mid-cap government contractor with 3 analysts and 70% of revenue from federal contracts is where a public database can still beat the crowd.
Here is the full script. Runs in Google Colab, no API key, no registration.
# USAspending edge test — do federal contract awards lead the stock?
# In Colab, run this first:  !pip install yfinance -q
import requests, pandas as pd, yfinance as yf

body = {
    "group": "quarter",
    "filters": {
        "recipient_search_text": ["PALANTIR"],
        "award_type_codes": ["A", "B", "C", "D"],   # contracts
        "time_period": [{"start_date": "2021-01-01", "end_date": "2026-06-30"}],
    },
}
r = requests.post("https://api.usaspending.gov/api/v2/search/spending_over_time/", json=body)
res = r.json()["results"]
q = pd.DataFrame([{
    "quarter": f"{x['time_period']['fiscal_year']}Q{x['time_period']['quarter']}",
    "obligations_$M": round(x["aggregated_amount"] / 1e6, 1),
} for x in res])
print(q.to_string(index=False))

# ---- Plot: contract awards vs stock price ----
import matplotlib.pyplot as plt

# fiscal quarter -> calendar quarter end (US fiscal year starts Oct 1)
q["date"] = pd.PeriodIndex(q["quarter"].str.replace("Q", "q"), freq="Q-SEP").to_timestamp(how="end")
pltr = yf.download("PLTR", start="2021-01-01", progress=False)["Close"].squeeze()

fig, ax1 = plt.subplots(figsize=(10, 5))
ax1.bar(q["date"], q["obligations_$M"], width=70, color="tab:blue", alpha=0.6,
        label="Federal contract obligations ($M/quarter)")
ax1.set_ylabel("Obligations $M", color="tab:blue")
ax2 = ax1.twinx()
ax2.plot(pltr.index, pltr, color="black", lw=1.2, label="PLTR stock")
ax2.set_ylabel("PLTR $")
ax1.set_title("Palantir: federal contract awards (USAspending.gov) vs stock")
fig.legend(loc="upper left", bbox_to_anchor=(0.1, 0.92))
plt.tight_layout()
plt.show()
Swap “PALANTIR” for “BOOZ ALLEN” or “LEIDOS” and the ticker to match, and you have the same analysis for any government contractor.
How would you actually use it?
Compare the current quarter’s contract total to the same quarter last year. If awards are running far above trend and the stock has gone sideways, you have a hypothesis worth testing before the next earnings date.
Two honest warnings.
An obligation is not revenue yet, multi-year deals get booked at once and paid out over years, so read the trend, never a single bar.
And when a company wins one giant headline contract, there is a press release and the move happens the same day. The edge is in the aggregate of small awards nobody reports on.
2. Insider cluster buys
Insider trades are public within two business days, SEC Form 4. Part 1 listed them as an information edge. Here is the part that matters in practice.
One insider buying means very little.
Insiders sell for a hundred reasons.
Taxes
Divorce
A new house
Diversification
But they buy their own stock for one reason only, they expect it to go up.
And when three or four insiders buy in the same two-week window, independently risking their own cash, that agreement is the signal.
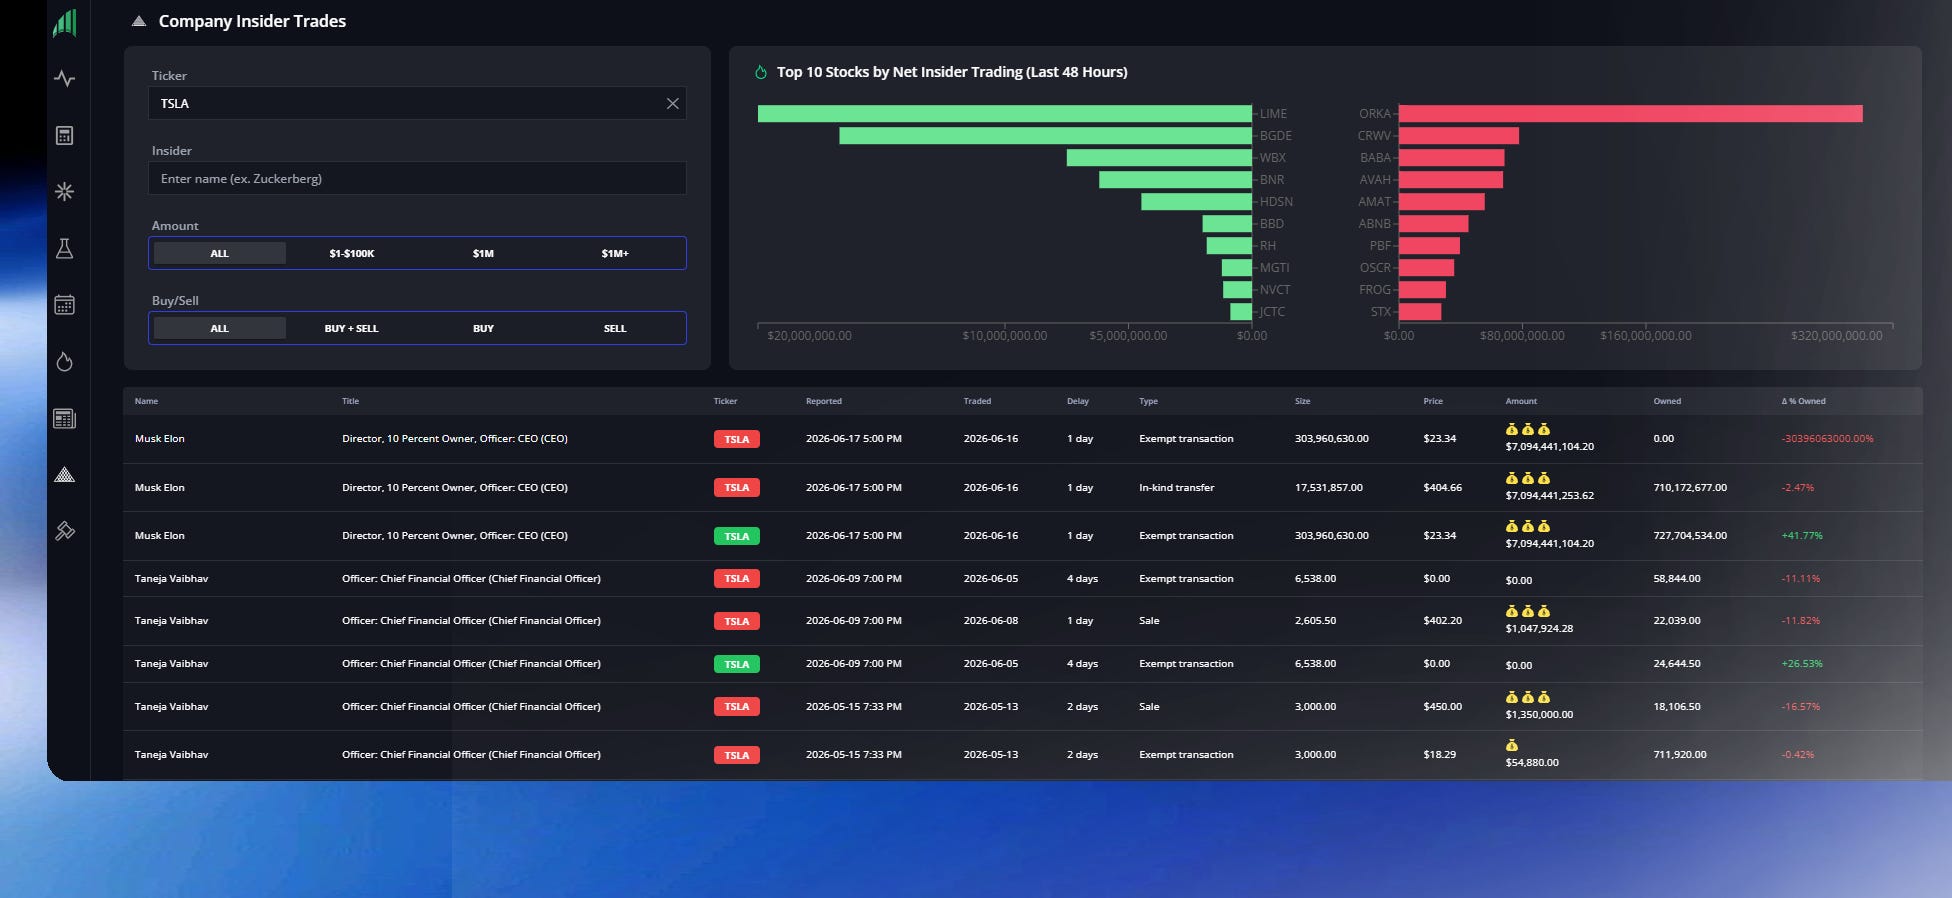
The free tool is InsiderFinance.io or (OpenInsider.com). It has a ready-made screen called Cluster Buys. Bookmark and check it weekly, and ignore everything that is a single purchase or a routine scheduled trade.
https://www.insiderfinance.io/insider-trades
A cluster buy is not a buy signal by itself. It is a shortlist generator. The names on it earn a closer look, a backtest, a place on your watchlist. That is the honest size of this edge.
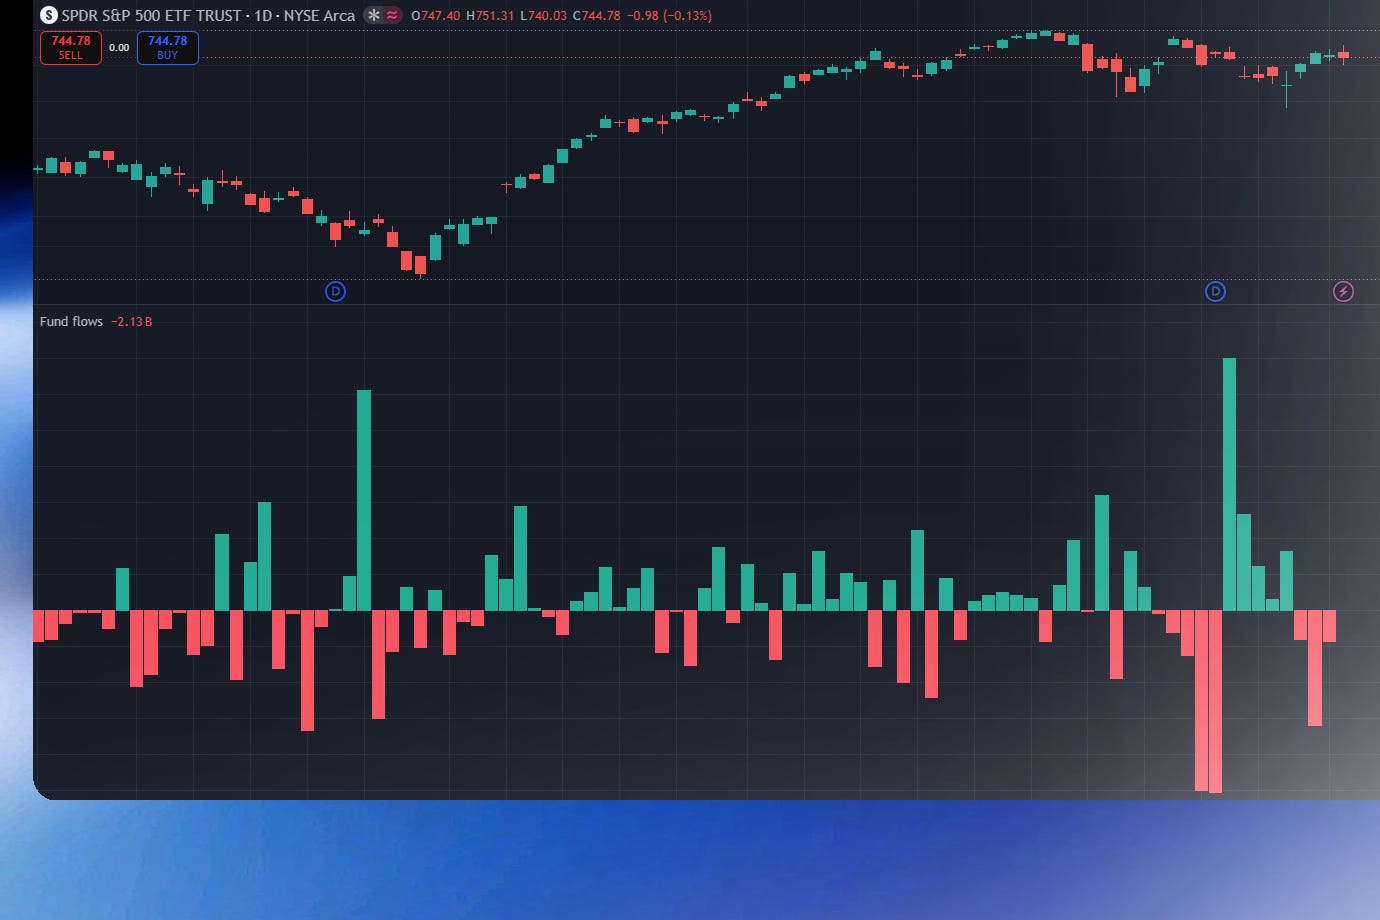
3. ETF fund flows
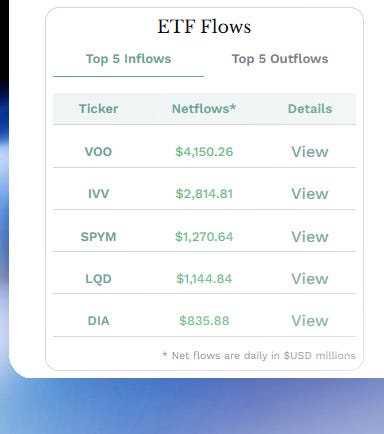
Every week, billions move in and out of sector ETFs, and the numbers are published for free (etf.com has a fund flows tool, most issuers publish their own).
Why this is readable. Large allocators move slowly and in size. When money starts flowing into energy ETFs week after week, that repositioning takes months to complete, and prices tend to grind in the same direction while it does.
TradingView.com SPY “Fund Flows“
The ten-minute weekly ritual.
Pull the week’s largest sector inflows and outflows.
Compare against the last three months of that sector’s performance.
What you are looking for is persistent flows into a sector that has not moved yet.
One warning here too. Flows chase performance, so a giant inflow after a huge rally is late money, not smart money. The information is in flows that arrive before the move, not after it.
Are you using RealTest too? → Here are my strategies.
4. Ship tracking, the sequel
In Part 1, I told you about my friend in aviation who trades airline stocks with FlightRadar24 open. Several readers asked for the maritime version. It exists, and it is the same idea on water.
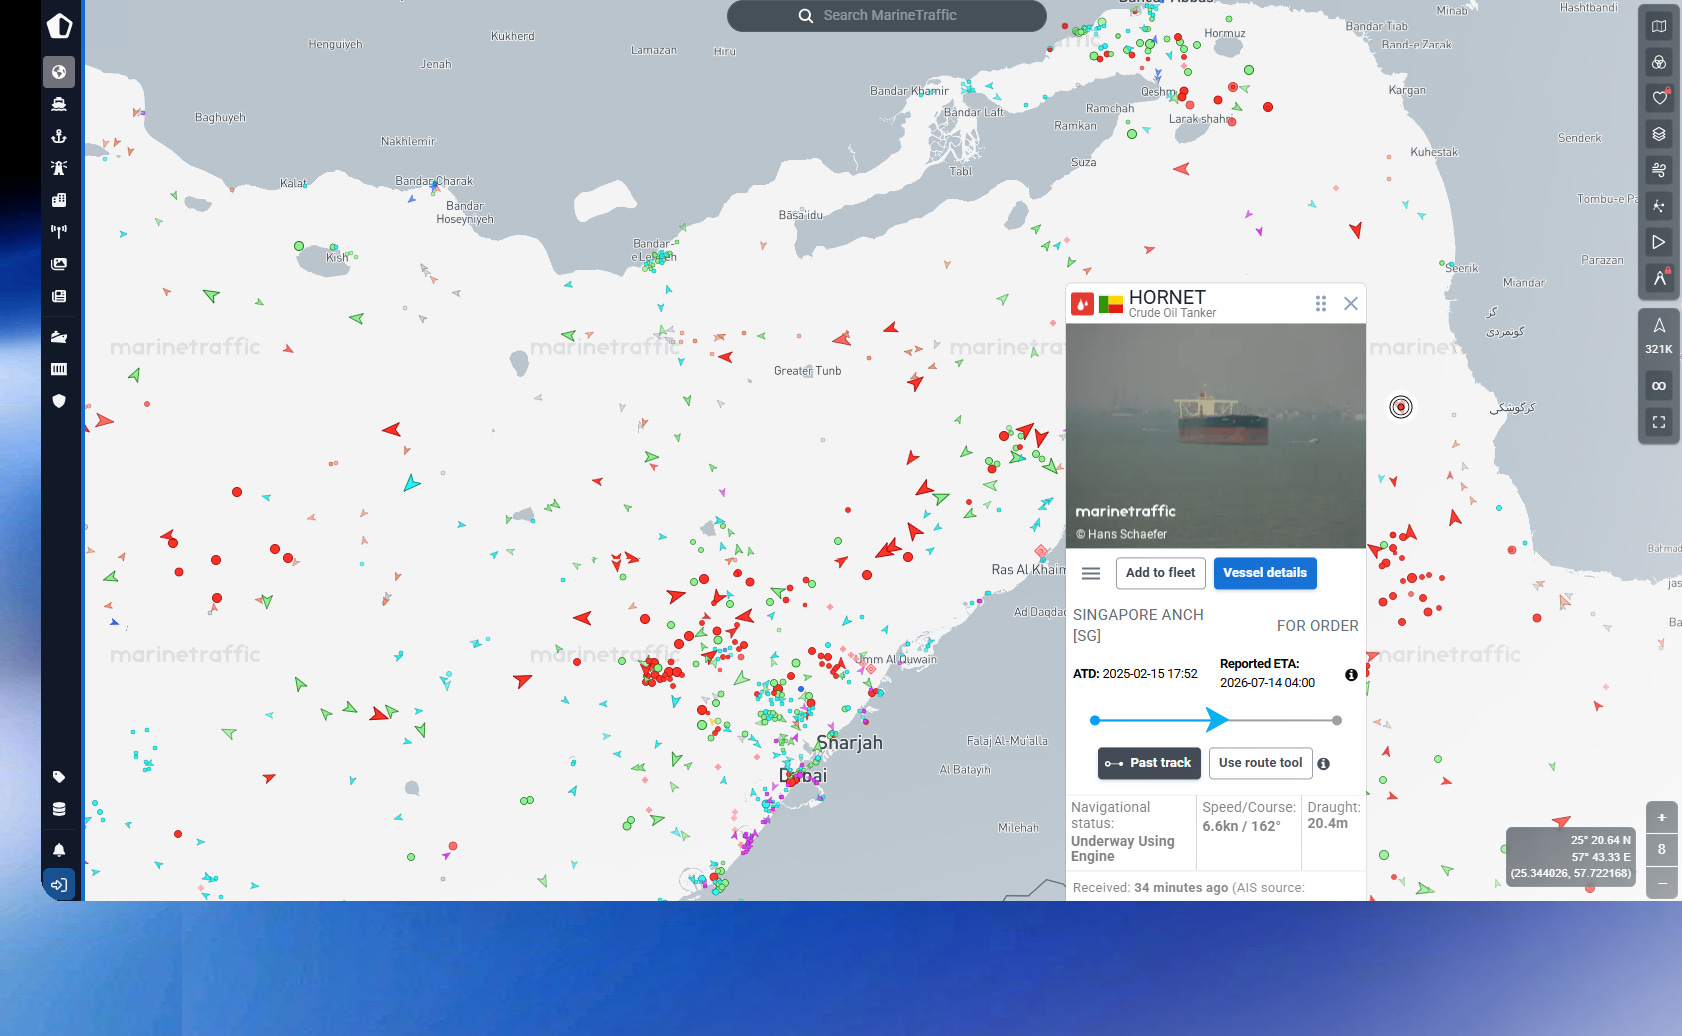
MarineTraffic shows you, live and free, nearly every commercial vessel on earth. Tanker traffic through the Strait of Hormuz. Container ships queuing outside Long Beach. Carnival’s cruise ships, sitting in port or out earning money.
Strait of Hormuz
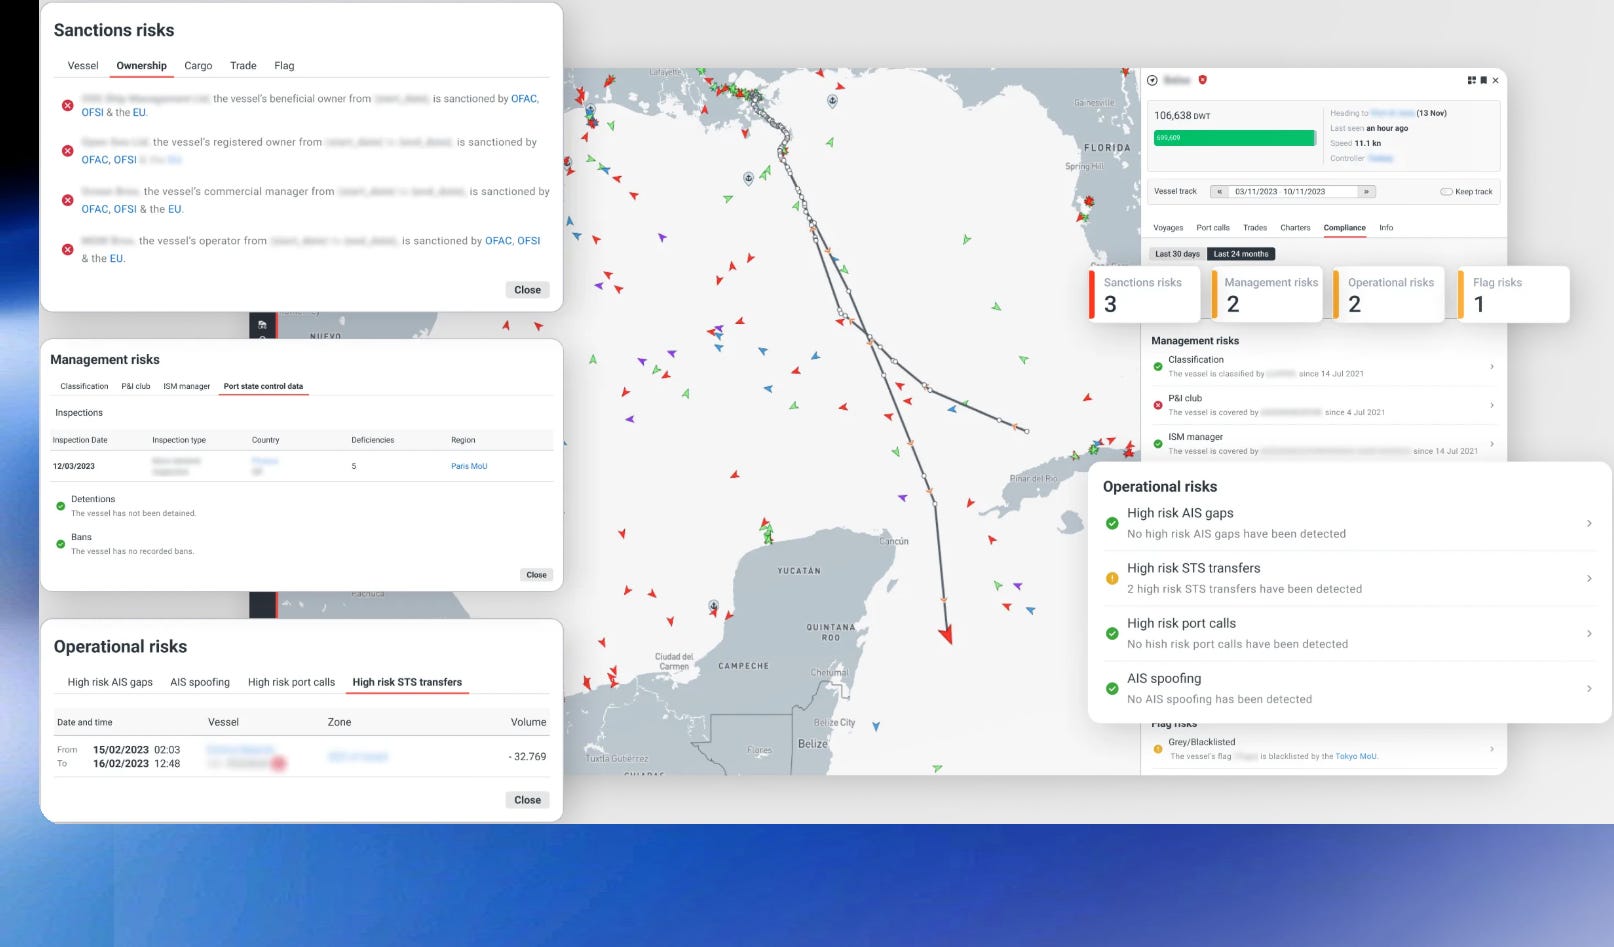
The professional version of this is Kpler, which sells exactly this data as a feed to funds. That tells you the signal is real. It also tells you the pros already have it, so do not try to out-count them on global oil flows.
Monitor sanctioned cargo movements across 40+ commodities that may put your business at risk.
The retail edge is narrower and it is the same one my aviation friend has. Depth in one niche. If you know cruise operators, tracking whether CCL’s fleet is sailing full schedules costs you nothing and takes minutes a week. You are not competing with Kpler’s clients there, because nobody at a fund is watching one cruise line’s fleet the way someone who knows the industry does.
Pick the industry you actually understand. The map is free.
5. Weather moves futures in minutes. Food stocks take weeks.
This idea sounds good. Drought hits the wheat belt, yields drop, wheat futures rise, and food processors like ADM or Bunge see margins move.
Here is the honest version.
The first part, from weather to futures prices, is over in minutes. Commodity desks run their own weather models and they are better at it than us. There is no retail edge in predicting wheat futures from a forecast.
The part you can still read comes after the futures have already moved. Wheat is an input cost for ADM and Bunge, so a 30% wheat spike changes their next two quarters of profit. The futures repriced in minutes. The stocks take weeks, because analysts need that long to rework their numbers.
So the practical version is this. Watch the commodity move itself, then study how the equities historically reacted in the following weeks. Wheat and corn futures are free in yfinance under the tickers ZW=F and ZC=F, the same way the script above pulls PLTR. If you want the weather data itself, Open-Meteo gives you historical and forecast weather for any coordinates on earth, free, no API key, no registration. One request gets you daily rainfall for the Kansas wheat belt going back decades. And the USDA publishes its weekly Crop Progress report every Monday afternoon, free, which is where crop condition actually gets scored.
It is a research project, not a signal service, and it only fits if agriculture is a space you want to know deeply. For everyone else, edges 1 to 3 are the better use of a weekend.
One screen is not a system
All five of these share a shape. Free public data, a lag the market is too busy to read, and a shortlist at the end.
A shortlist is not a strategy. Every name these screens produce still owes you the real work, rules, costs, out-of-sample testing, the things Part 1 was built on. The screen finds the candidate. The backtest decides.
What to try this week:
Run the USAspending script. Change the company name once. You now have an alternative-data tool of your own, which is one more than you had yesterday.
Bookmark OpenInsider’s Cluster Buys page and one ETF flows tool. Ten minutes, once a week.
Write down the one industry you know better than a generalist analyst. That is where your version of the FlightRadar24 edge lives.
Most of these edges will not drop straight into RealTest. Insider clusters and contract awards have no clean historical data file (but you can make it by using python), so there is nothing to backtest them against yet.
What they give you is ideas your backtests would never surface on their own. New names for the watchlist and an earlier read on the sectors you already trade.
The coming articles return to the testable kind. Rules, backtests, RealTest code included. If you run RealTest, subscribe now, because those are the ones you can paste in and verify yourself.
See you next week! Subscribe so it lands in your inbox.
These five were the edges you can test for free.
Part 1 has the full map they came from, all 60+, from broker and execution edges to volatility and calendar effects. 👇