

Your Best Year Is Hiding a Problem Inside Your Backtest (Here’s how to fix this)
Run this test to find out if yours is one of them.

Academic papers get published regularly with backtested Sharpe ratios above 3. Sometimes 4. Peer-reviewed, clean methodology, credible authors.
Run the year-deletion test on most of them. Half collapse.
Not because the research is bad. Because aggregate metrics hide what individual years reveal. A strategy can produce a 2.4 Sharpe across 15 years and still be carrying a single event that generated 60% of the total return. Remove that year, and the Sharpe drops below 1. The paper does not mention this. The authors likely never tested it.
This is not a problem unique to academia. It is structural to how backtests are evaluated.
There is a test that takes less than 60 seconds. It exposes the dependency that aggregate metrics cannot see.

Why Standard Risk Metrics Miss This
Sharpe, Sortino, CAR/MDD etc none of these metrics reveal how returns were structured.
They confirm that returns existed. They do not expose the architecture underneath: where alpha was concentrated, what regime generated it, and whether that regime has any reason to repeat.
A strategy with a 1.2 Sharpe and a hidden dependency on a single market dislocation is not a robust strategy. It is a one-event position that happened to backtest across 10 years without revealing itself.
The Sharpe does not see it. The drawdown does not see it. The win rate does not see it.
One test does.

The Test
Open the backtest. Pull up the yearly performance table. Identify the year with the highest contribution to overall equity. Delete it.
In RealTest:
EntrySkip: Year=2020
Run the backtest again. Observe the CAGR, drawdown, and equity curve as if that year never occurred.
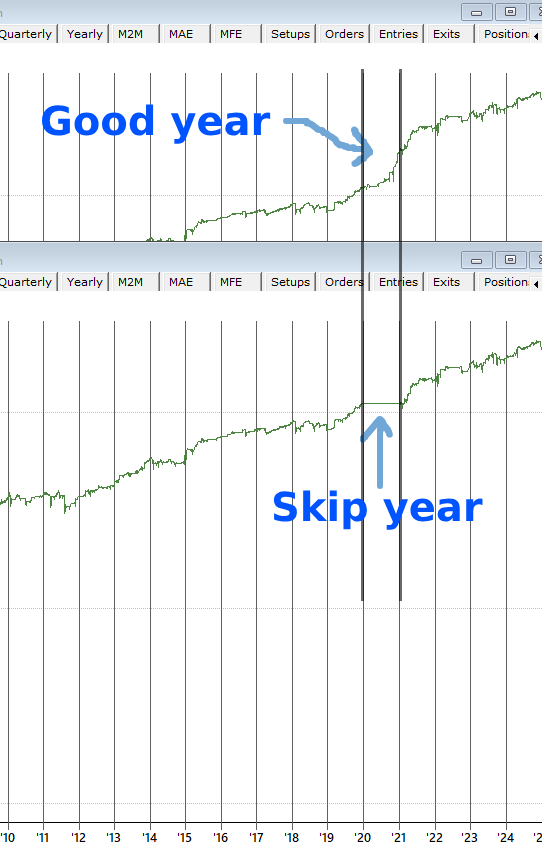
This is the strategy without its best witness.

Reading the Output
The numbers will drop. The common response: “Of course, I removed a good year.” That is rationalization, not analysis.
The correct question is not whether the numbers dropped. It is by how much they should drop.
A system generating 17% CAGR over 10 years with one year removed should still produce something real. If the residual is 3%, this is not a 10-year strategy. It is a 1-year strategy that avoided ruin for 9 years. A fundamentally different instrument.

The Questions This Exposes
The best year is identified. But the diagnostic has barely started.
Does the entry logic align with a macro regime that has not existed since that year? Did the exits function because of a volatility environment that permanently shifted after 2022? Is the edge in the system itself or is the system waiting, year after year, for conditions that may not return?
There is a deeper version of this test. One that separates structural alpha from situational alpha. The difference between a system traded with conviction and one traded on hope.
That is what the second half builds.