

These 7 Indicators Still Generate Alpha in Your Mean-Reversion Trading
The 7 indicators with minimal lag and strong performance across volatility regimes.

Mean reversion has always been one of the most reliable edges in systematic trading.
But markets evolve, and strategies that worked in the 1990s or even early 2010s don’t behave the same today.
The combination of:
faster liquidity cycles
algorithmic execution
increased ETF flows
macro-driven volatility clusters
and daily intervention from passive indexing
…has reshaped the behavior of short-term “buy the dip” signals.
The good news:
mean reversion still works but only when you modernize it.
In this article, we’ll look at the 7 most statistically robust indicators for mean reversion trading.
Let’s start with the foundation.

What Mean Reversion Really Trades: Liquidity Imbalance
Newer traders treat mean reversion like a prediction game:
Price is oversold → price should bounce.
But the real mechanic is simpler and more structural.
When markets sell off quickly:
liquidity disappears
spreads widen
short-term volatility spikes (+ volume spike)
forced sellers push price beyond equilibrium
When you step in and buy during these conditions, you’re stepping into a liquidity vacuum.
You’re being compensated for taking the other side of stress-driven flows.
The “reversion” is the market normalizing after the imbalance clears.
Basically you are not forecasting but you are providing liquidity.
This is why the edge has persisted for decades the underlying human behavior hasn’t changed.

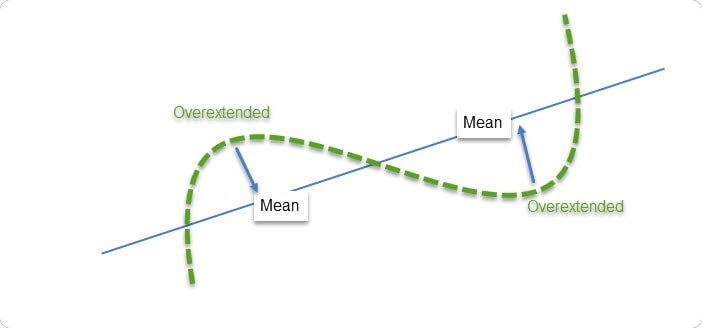
The Statistical Basis: Stretch vs. Stability
Mean reversion thrives on the simple observation:
Markets rarely stay 2–3 standard deviations from their mean for long.

Sharp deviations are usually followed by normalization unless the market is transitioning into a crisis regime.

The 10 Most Robust Mean-Reversion Indicators
These indicators were selected using three criteria:
Strong performance across multiple volatility regimes
Minimal lag
Clear statistical structure
Widely supported in academic papers
Let’s break them down, starting from the foundation to the highest alpha generators.
7. Z-Score (Normalized Stretch)
The pure statistical approach:
Z = (Price − Mean) / StdDev
Some traders look at raw price drops. That’s a mistake. A $5 drop in a low volatility environment is significant. A $5 drop when VIX is at 40 is noise.
The Z-score standardizes this. It tells you how many standard deviations price is from the mean.
6. Keltner Channel Deviations (ATR-based)
ATR-based bands are more stable during high volatility.
They outperform standard deviation bands during macro-driven months where volatility clusters but price direction chops.
5. Williams %R (Shortened Lookback)
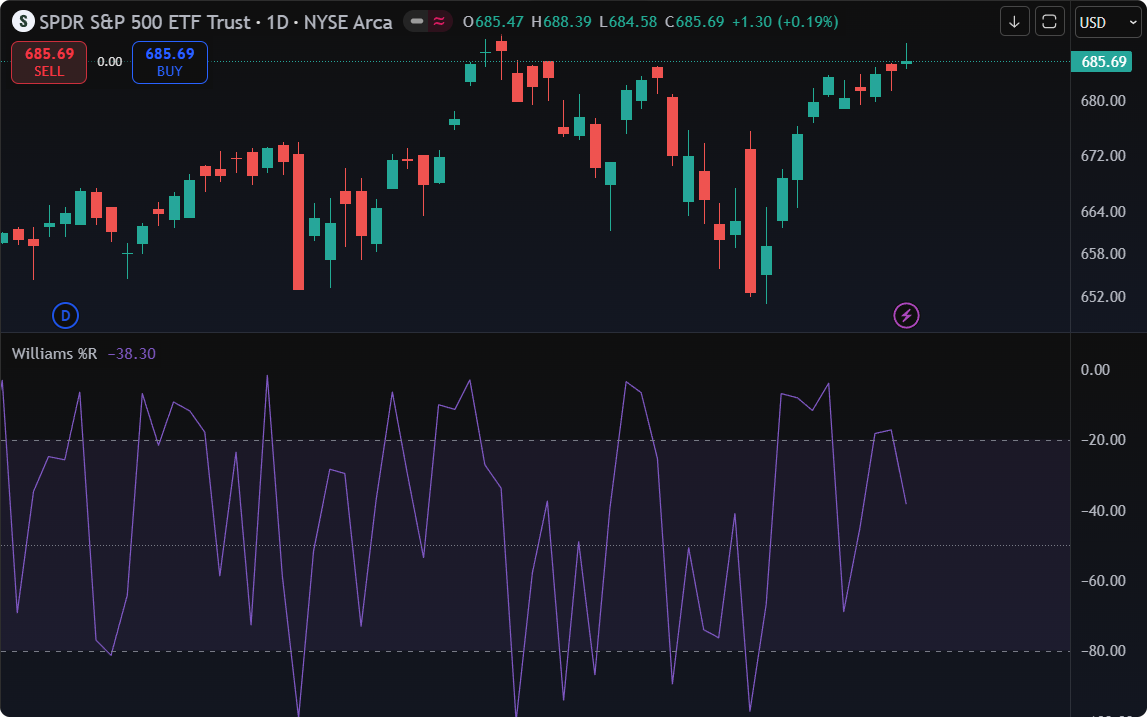
A raw measure of where price closes within recent range.
Short lookbacks (3–5 days) reduce lag and track high-frequency washouts with surprising accuracy.
4. Distance from Moving Average (DMA)
DMA = Daily Moving Average
The percentage distance from a short-term mean (5–10 period SMA).
Institutions often fade statistically stretched deviations, especially when driven by short-term liquidations.
The Top 3: High-Fidelity Signal Generators
These three indicators form the backbone of many professional systematic strategies.